Introduction
Most teams can demo agentic coding in a day. The hard part is proving AI coding ROI in a way that survives security review, procurement, and a postmortem.
This guide is for CTOs and Heads of Engineering who need a measurement system that answers three questions:
- Are we shipping faster, or just generating more code?
- Are we improving quality, or pushing risk downstream into QA and on call?
- Are we reducing cost per accepted change, or just moving spend from payroll to tokens?
Insight: Activity is cheap. Evidence is what changes budgets.
You will see a practical structure we use in delivery: capture a baseline in week 1, freeze pilot success criteria before embedding, then make a scale decision using a rubric that includes flow, quality, control, and economics.
We will reference patterns from our work shipping production systems across 360+ projects, including fast delivery constraints (Miraflora Wagyu in 4 weeks) and high scale platforms (ExpoDubai 2020 reaching 2 million visitors). Those projects were not “AI projects”, but the measurement discipline is the same: instrument early, decide with data, and keep auditability in mind.
What this article is not
It is not a list of AI tools.
It is not a promise that agents replace engineers.
It is a measurement playbook for agentic engineering metrics that helps you decide where agents fit and where they don’t.
If you want one sentence: treat agentic work like any other engineering change. Track it from idea to production, and price it like any other capacity.
Evidence over activity
If you measure the wrong thing, you will scale the wrong behavior. Agentic systems are great at producing visible output: diffs, comments, tickets, docs. That output can look like progress while your actual throughput stays flat.
Measure outcomes that map to delivery. Ignore vanity signals.
What to measure
Evidence to track
Track metrics that are hard to fake and easy to audit:
- Accepted changes: merged PRs that shipped, not drafts.
- Time to ship: from first commit to production.
- First pass success: changes that pass CI and review without major rework.
- Escaped defects: incidents or bugs linked to a change.
- Policy compliance: did the change meet security and licensing rules.
- Economics: cost per accepted change, plus rework cost.
Key Stat: In our SaaS delivery work, a proven boilerplate has saved 300+ hours by reducing setup and rework. The same principle applies to agentic work: savings come from removing repeatable effort, not from generating more artifacts.
What to ignore
These signals often correlate with excitement, not ROI:
- Lines of code generated
- Number of prompts
- Number of agent messages
- Number of PRs opened
- “Time in tool” dashboards
- Raw completion rate without acceptance
If you want a quick sanity check, ask: could someone inflate this metric without shipping anything? If yes, it’s not a decision metric.
DORA metrics AI adoption, but with guardrails
DORA metrics are still the best backbone for DORA metrics AI adoption discussions. But agents change the failure modes.
Two adjustments that help:
- Track DORA metrics per change type (docs, refactor, feature, infra). Agents can boost low risk work first.
- Add a control layer (auditability, escalation, policy checks). Without it, faster delivery can mean faster noncompliance.
_> Proof points to anchor ROI conversations
Use these as context, then measure your own deltas
ROI measurement workflow
_> A simple path from baseline to scale decision
→ Scroll to see all steps
Week 1 baselines that hold up
Baselines are boring. They also prevent politics.
On Agentic Enablement, freezing that baseline is the job of Diagnostic (typically 2 to 3 weeks): current delivery evidence, friction map, and a pilot plan with success criteria written before tools expand. Transformation follows only when the baseline and gates are real. Do not treat seat licences as ROI.
You need a “before” picture that is:
- Small enough to capture in a week
- Consistent across squads
- Tied to your actual delivery system (Git, CI, issue tracker, deploy logs)
Insight: If you can’t baseline it, you can’t claim ROI. You can only claim vibes.
Baseline capture worksheet (assessment week 1)
Baseline worksheet template
Use this worksheet for one representative team (or one product slice). Capture the last 4 to 6 weeks.
Scope and sampling
- Team:
- Repos in scope:
- Services in scope:
- Environments: dev, staging, prod
- Time window: last 4 to 6 weeks
- Change types to tag: feature, bugfix, refactor, infra, docs
Flow metrics (baseline)
- Lead time (median, p75)
- Cycle time (median, p75)
- Review wait time (median, p75)
- Deployment frequency (per week)
Quality metrics (baseline)
- First pass success rate
- Escaped defects per 100 changes
- Change failure rate
- Mean time to restore (if you track it)
Control metrics (baseline)
- Policy compliance pass rate (SAST, secrets, license)
- Escalation rate (how often work needed senior intervention)
- Auditability coverage (what percent of changes have traceable rationale)
Economics (baseline)
- Hours spent per accepted change (estimate via time tracking or sampling)
- Rework hours per accepted change (review churn, CI fixes, rollback work)
- Tooling costs attributable to delivery (CI minutes, environments)
Baseline checklist for instrumentation
- Confirm PR timestamps are reliable (opened, first review, approved, merged)
- Confirm deploy events are logged (tag, pipeline run, release artifact)
- Confirm incident links exist (issue or postmortem references)
- Confirm policy scanners run on every PR
Baseline table you can paste into a doc
| Metric | Definition | Source of truth | Baseline window | Notes |
|---|---|---|---|---|
| Lead time | First commit to production deploy | Git plus deploy logs | 4 to 6 weeks | Track median and p75 |
| Cycle time | PR opened to merged | Git provider | 4 to 6 weeks | Split by change type |
| Review wait | PR opened to first human review | Git provider | 4 to 6 weeks | Watch for timezone effects |
| Deployment frequency | Prod deploys per week | CI CD | 4 to 6 weeks | Normalize per service |
| First pass success | PRs merged without major rework | Git plus review data | 4 to 6 weeks | Define “major rework” |
| Escaped defects | Incidents or bugs tied to a change | Incident tracker | 4 to 6 weeks | Use a consistent linkage rule |
| Change failure rate | Deploys causing incident or rollback | CI CD plus incidents | 4 to 6 weeks | Define “failure” once |
| Policy compliance | PRs passing required checks | CI policy gates | 4 to 6 weeks | Include secrets and licenses |
| Escalation rate | Work needing senior override | Review tags | 4 to 6 weeks | Requires a lightweight tag |
| Cost per accepted change | AI plus labor plus CI cost per merged PR | Finance plus logs | 4 to 6 weeks | Use blended rates |
Pilot design that avoids self deception
A pilot fails in two common ways.
First: you embed agents everywhere, then you can’t isolate impact.
Second: you pick easy work only, then you can’t generalize.
A good pilot is narrow, instrumented, and frozen before the team gets attached.
Freeze success criteria before embedding
Pilot success criteria (frozen list)
Write this down before you roll tools out broadly. Treat it like an SLO.
Scope
- 1 team, 1 repo, 1 service boundary
- 2 to 4 weeks
- Exclude major roadmap shifts
Primary success criteria (must hit)
- Lead time improves by X% without increasing change failure rate
- First pass success improves by X points
- Policy compliance stays at or above baseline
Secondary success criteria (nice to have)
- Review wait time decreases
- Deployment frequency increases without more incidents
- Rework hours per accepted change decrease
Failure criteria (stop signals)
- Escaped defects increase above baseline by X%
- Escalation rate rises above X% for two weeks
- Auditability drops below X% coverage
Example: In fast turnaround builds like Miraflora Wagyu (4 weeks), the constraint isn’t “write more code”. It’s “compress feedback loops without breaking quality”. That’s why review wait and rework are usually better pilot targets than raw throughput.
A simple pilot setup
Run the pilot with three lanes:
- Agent suggested work: scaffolds, refactors, test drafts, doc updates.
- Human owned work: requirements, architecture decisions, risky migrations.
- Shared work: bug triage, incident follow ups, performance fixes.
Then tag PRs so you can separate:
- Agent assisted
- Agent authored but reviewed
- Human only
This is the only way to make ROI arguments that don’t collapse under scrutiny.
What usually works first
Based on what holds up in production in 2026, the first wins tend to be:
- Scaffolding and boilerplate generation
- Mechanical refactors with strong tests
- Test drafts that engineers tighten
- Documentation and “how it works” updates
- “Find the bug” loops with clear reproduction steps
What tends to fail early:
- Deep product tradeoffs
- Ambiguous requirements
- Legacy code with weak test coverage
- Cross service changes without strong ownership
Label this as an observation. Validate it in your pilot by tracking change type outcomes.
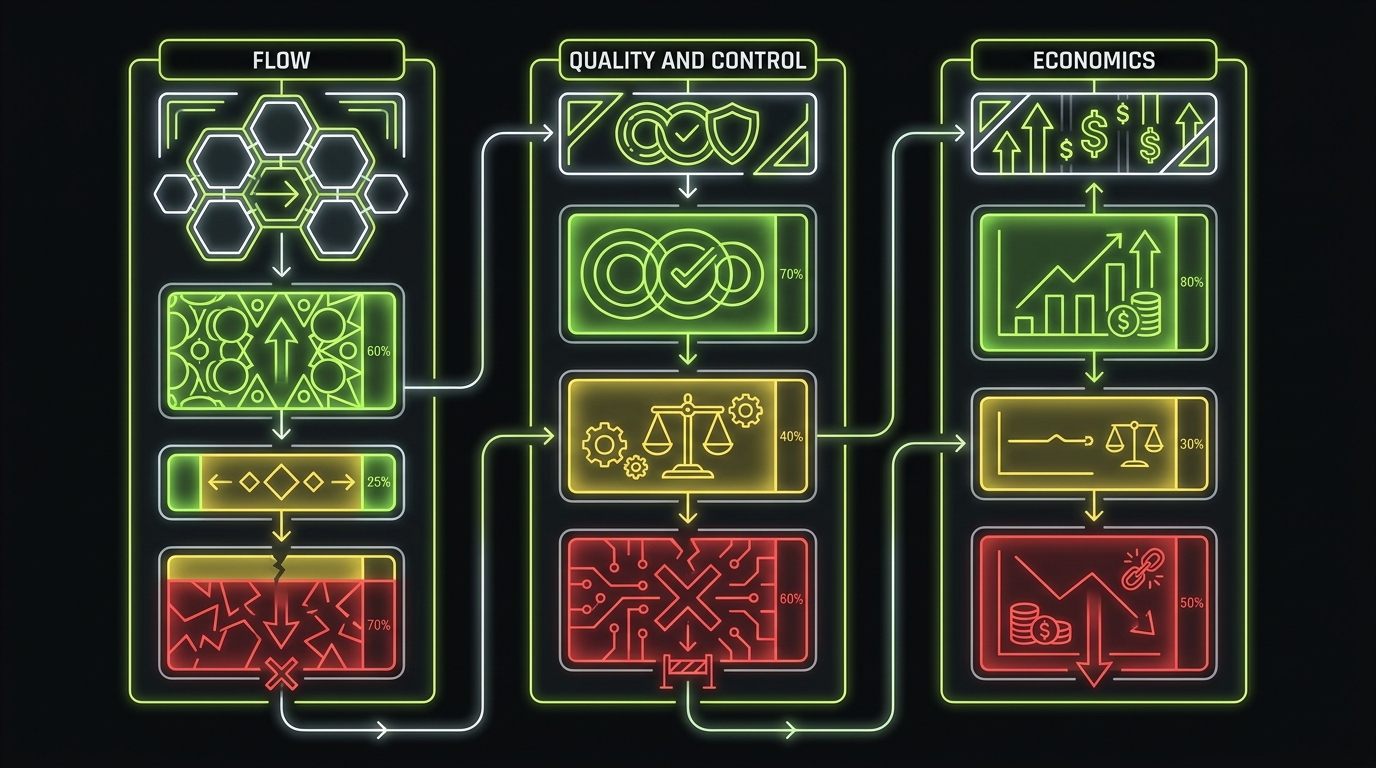
Agentic engineering metrics that matter
_> Four buckets that keep ROI honest
Flow
Lead time, cycle time, review wait, deployment frequency. Track median and p75.
Quality
First pass success, escaped defects, change failure rate. Tie to incidents and rollbacks.
Control
Policy compliance, escalation rate, auditable agent activity. Non negotiable in regulated environments.
Economics
AI cost per accepted change, hours saved via sampling, rework cost. Segment by change type.
Scorecards that survive procurement
Executives and procurement do not want 30 metrics. They want six that are stable, defensible, and tied to risk.
Executive scorecard: 6 metrics
The six metrics
Use these six for board level and procurement review. Everything else is diagnostic.
- Lead time to production (median and p75)
- Deployment frequency (per week)
- Change failure rate (percent)
- Escaped defects (per 100 changes)
- Policy compliance pass rate (percent)
- AI cost per accepted change (currency per merged PR that shipped)
Key Stat: ExpoDubai 2020 served 2 million visitors. At that scale, a small increase in change failure rate can wipe out speed gains. That’s why the scorecard must include quality and control, not just flow.
How to compute AI cost per accepted change
Define it so Finance can audit it:
- Numerator: model usage costs plus agent platform costs plus incremental CI costs
- Denominator: accepted changes that shipped to production
Then segment by change type. You will usually see better economics in routine work first.
AI cost per accepted change =
  (LLM tokens cost + agent tool subscriptions + incremental CI minutes cost)
  / (# of shipped PRs tagged agent assisted)
If you can’t tag shipped PRs cleanly, stop and fix the tagging. Otherwise you will argue about the denominator forever.
Flow metrics to track weekly
Flow is where speed shows up. Track these as your core agentic engineering metrics:
- Lead time: first commit to production
- Cycle time: PR opened to merged
- Review wait: PR opened to first review
- Deployment frequency: production deploys per week
Practical tips:
- Use median and p75, not averages.
- Split by change type.
- Track “time in review” separately from “time waiting for review”. Agents often reduce the former, not the latter.
Quality metrics that prevent regret
Quality is what keeps the pilot from turning into a rollback festival:
- First pass success: passes CI and review without major rework
- Escaped defects: bugs and incidents tied to a change
- Change failure rate: deploys causing rollback, hotfix, or incident
Control metrics for regulated teams
If you ship in healthcare, finance, or anything with customer data, control metrics are not optional:
- Policy compliance: secrets scanning, SAST, dependency licensing
- Escalation rate: how often agents need senior override
- Auditable agent activity: can you reconstruct why a change happened
A good rule: if you can’t explain a change in an audit, you can’t ship it.
Engineering AI economics that matter
Economics is where pilots get killed or funded:
- Hours saved: measured via sampling, not self reported optimism
- Rework cost: review churn, CI fixes, incident time
- AI cost per accepted change: the clean unit
Insight: The cheapest code is the code you didn’t have to rewrite next week.
What a good ROI system gives you
Fewer debates
You stop arguing about opinions and start reviewing deltas against a baseline.
Safer speed
Flow improvements are paired with change failure rate and escaped defect tracking.
Audit ready changes
You can explain who changed what, why, and under which policy gates it passed.
Cleaner budgeting
AI cost per accepted change creates a unit cost Finance can compare to internal capacity.
Conclusion
When you are ready to turn baselines into a governed program, start with Agentic Enablement Diagnostic. This path is for engineering organizations with a sponsor and a real pilot workflow, not a substitute for a founder MVP.
Agentic engineering can pay off. It can also create a quiet tax: more review load, more rework, more incidents, and less clarity about who changed what.
If you want engineering AI economics you can defend, do four things in order:
- Capture a baseline in week 1 from systems of record.
- Freeze pilot success criteria before embedding.
- Run a tagged pilot that separates agent assisted changes from human only changes.
- Make a scale decision with a rubric that includes flow, quality, control, and cost.
Final check: If your ROI story does not include change failure rate and policy compliance, it will not survive production.
Next steps you can take this week:
- Pick one team and run the baseline worksheet.
- Choose one narrow workflow (refactors, test drafts, docs) and pilot it for 2 to 4 weeks.
- Put the six metric scorecard in front of Finance and Security early.
- Decide upfront what “stop” looks like, then honor it.
That is how you turn AI enthusiasm into measurable AI coding ROI without betting the roadmap.
Scale, adjust, or stop rubric
Use this rubric at the end of the pilot. Keep it boring and consistent.
| Decision | Flow signals | Quality signals | Control signals | Economics signals |
|---|---|---|---|---|
| Scale | Lead time down 15%+ and review wait not worse | Change failure rate flat or down; escaped defects flat or down | Compliance pass rate at baseline or better; auditability 90%+ | AI cost per accepted change below your internal hourly threshold |
| Adjust | Lead time down 5% to 15% but review wait up | First pass success down slightly | Escalation rate up but explainable | Costs flat; savings show only in certain change types |
| Stop | Lead time flat; cycle time worse | Escaped defects up 20%+ or change failure rate up | Compliance failures increase or audit trail missing | AI cost per accepted change higher than baseline cost |
Example thresholds you can start with (tune to your org):
- Scale if lead time median improves 15%+ for two consecutive weeks
- Stop if change failure rate increases 2 points for two consecutive weeks
- Stop if policy compliance pass rate drops below 98% on required gates
- Adjust if escalation rate exceeds 25% of agent tagged PRs
The point is not the exact numbers. The point is agreeing on them before the pilot starts.
Use sampling. Pick a weekly set of agent tagged PRs, interview the author for 5 minutes, and record what work was avoided or reduced. Compare to baseline PRs of the same change type.
Treat it as a stop or adjust signal. Faster shipping is not a win if change failure rate rises. Narrow scope to safer change types, improve tests, and tighten policy gates.
Use them as the backbone, but add control and economics. DORA alone won’t capture auditability, compliance risk, or token spend per accepted change.
Policy gates on every PR, secrets scanning, dependency licensing checks, and an auditable log of agent actions tied to PRs. Without that, you will fail audits or slow down later with retrofits.