Introduction
Cloud bills rarely explode because of one big mistake. They creep up.
A new environment here. A bigger instance there. A “temporary” log setting that never gets turned off. Then the CFO asks a simple question: what are we paying for, and what do we get back?
This guide is a FinOps playbook for teams running cloud at scale. It focuses on repeatable moves that show up in invoices within weeks, not quarters.
You’ll get:
- A cloud cost optimization checklist you can run monthly
- Concrete tactics to reduce AWS costs without breaking production
- Templates for dashboards, allocation, and governance
Insight: Cost optimization is not a one time project. It’s an operating system: allocation, feedback loops, and ownership.
What “at scale” changes
At small scale, you can optimize by intuition. At scale, intuition fails.
Common scale signals:
- Hundreds of accounts, projects, or microservices
- Multiple teams shipping daily
- Shared platforms where nobody “owns” the bill
- A mix of steady workloads and spiky traffic
In our delivery work on high traffic platforms like Viu (video on demand across 14 countries) and large digital experiences like ExpoDubai 2020 (2 million visitors), we’ve seen the same pattern: performance and reliability get attention first. Costs follow later. The fix is to design cost visibility and guardrails into the system, then optimize in layers.
_> Proof points we use in delivery
Scale and speed matter when you optimize production systems
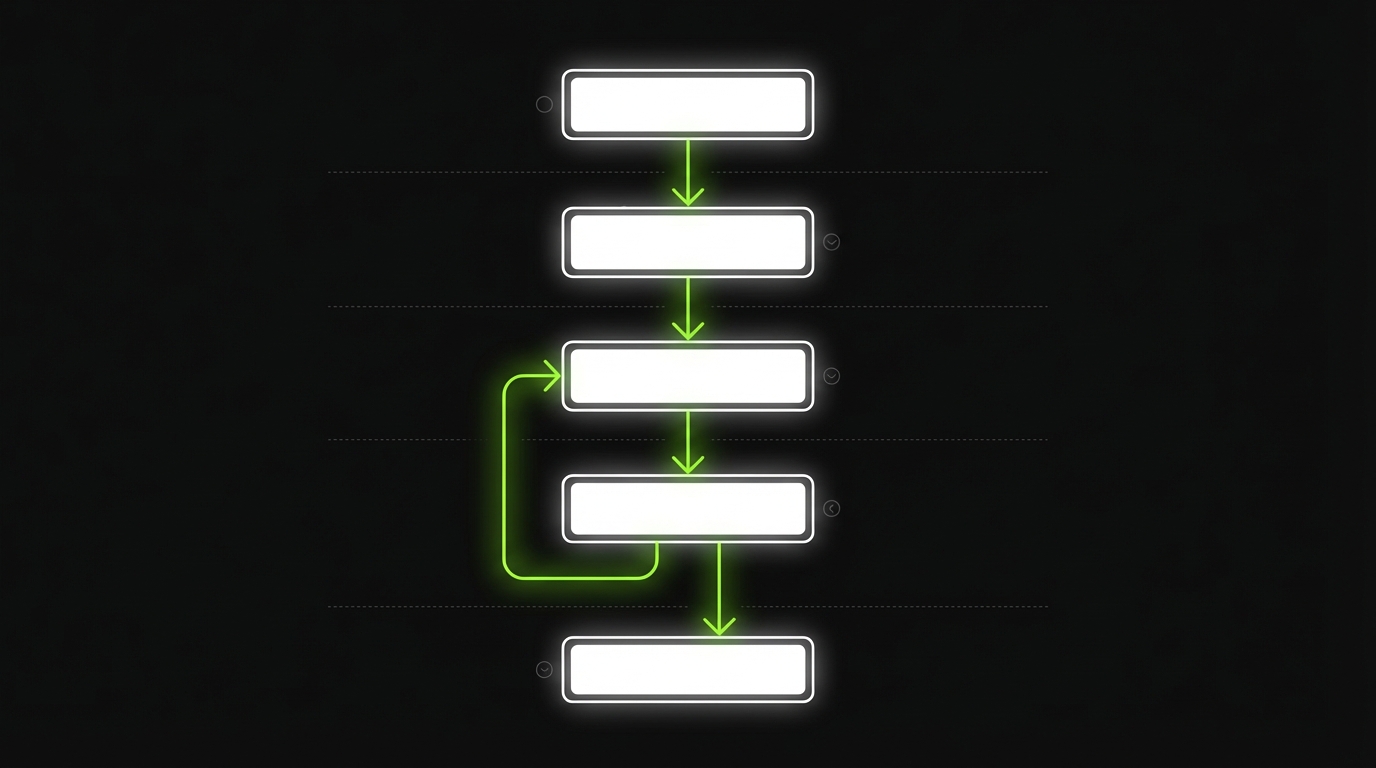
The 30 day FinOps rollout
_> A sequence that works for busy teams
→ Scroll to see all steps
The cost problem, clearly
Before you optimize, get specific about what’s driving spend and why it’s hard to control.
Most teams struggle because:
- No allocation: spend sits in “shared” buckets
- No baselines: you can’t tell if a change helped
- No owners: savings ideas die in a backlog
- No guardrails: engineers can create spend faster than finance can notice
Key stat: In practice, teams that can’t attribute at least 80% of spend to an owner usually stall on optimization. Treat this as a maturity gate.
Here’s a simple way to separate noise from signal.
| Spend type | Typical cause | How it hides | First fix |
|---|---|---|---|
| Compute | Overprovisioned instances, idle clusters | “It’s safer this way” | Rightsize and schedule |
| Storage | Old snapshots, logs, duplicated data | Nobody deletes “just in case” | Lifecycle policies |
| Data transfer | Cross AZ chatter, egress | Architecture decisions | Caching and topology |
| Managed services | Default settings, no limits | Set and forget | Quotas and alerts |

Cloud cost optimization checklist (monthly)
Run this every month. Don’t debate it. Just run it.
- Allocation
- 90%+ of spend tagged to service, team, env, cost center
- Unallocated spend list reviewed and assigned
- Compute
- Top 20 compute resources reviewed for utilization
- Idle or underutilized resources flagged with owners
- Scheduling
- Non production environments auto stop outside working hours
- Batch jobs moved to off peak windows where possible
- Architecture
- Cache hit rate reviewed for top endpoints
- Cross AZ and egress reviewed for top talkers
- Governance
- Budget alerts tested (not just configured)
- Policy violations reviewed and fixed
If you can’t complete this checklist in 60 minutes, you have an observability and ownership problem, not an optimization problem.
Top savings moves with impact estimates
Use as a prioritization list for the next sprintThese are typical ranges we see across mature cloud estates. Your numbers will vary. Treat them as hypotheses and validate with billing data.
| Move | Typical savings range | Time to first result | Risk level | What to measure |
|---|---|---|---|---|
| Schedule non prod off hours | 10% to 30% of non prod | 1 to 7 days | Low | Runtime hours, developer friction tickets |
| Rightsize top 10 compute | 5% to 20% of compute | 1 to 14 days | Medium | P95 latency, error rate, CPU and memory headroom |
| Remove orphaned storage and snapshots | 2% to 10% of storage | 1 to 14 days | Low | GB by age, restore tests |
| Fix cross AZ chatter | 5% to 25% of data transfer | 2 to 6 weeks | Medium | Cross AZ bytes, service call graph |
| Add caching to hot endpoints | 5% to 30% of compute plus egress | 2 to 8 weeks | Medium | Cache hit rate, origin RPS, egress |
| Commit discounts reserved capacity | 5% to 15% of steady spend | 1 to 4 weeks | Medium | Utilization, coverage, forecast error |
Quick prioritization rule:
- If it’s reversible in minutes, do it early.
- If it needs architecture work, do profiling first.
- If it needs a commitment, fix allocation and forecasting first.
Tagging and allocation discipline
Allocation is the foundation. Without it, you can’t run a fair conversation about cost.
The goal is simple: every meaningful dollar has an owner who can act.
What works in practice:
- Mandatory tags at resource creation
- Enforced defaults via IaC modules
- Chargeback or showback so teams see their trends
- Unallocated spend SLO (yes, treat it like reliability)
Insight: Tagging is not for finance. It’s for engineering. It tells you which systems are expensive per user, per request, or per release.
A tagging spec that survives reality
Keep it small. Enforce it hard.
Minimum viable tag set:
- product: the customer facing product area
- service: API, worker, frontend, data pipeline
- team: owning team name
- env: prod, staging, dev
- cost_center: finance mapping
- owner: email or on call alias
Rules that prevent drift:
- Tag keys are fixed. No synonyms.
- Tag values come from a registry. Avoid free text.
- No tag, no deploy. Enforce in CI and IaC.
Code example for Terraform style validation:
variable "tags" {
  type = map(string)
}

locals {
  required = ["product", "service", "team", "env", "cost_center", "owner"]
  missing  = [for k in local.required : k if !contains(keys(var.tags), k)]
}

resource "null_resource" "validate_tags" {
  lifecycle {
    precondition {
      condition     = length(local.missing) == 0
      error_message = "Missing required tags: ${join(", ", local.missing)}"
    }
  }
}
This is boring code. That’s why it works.
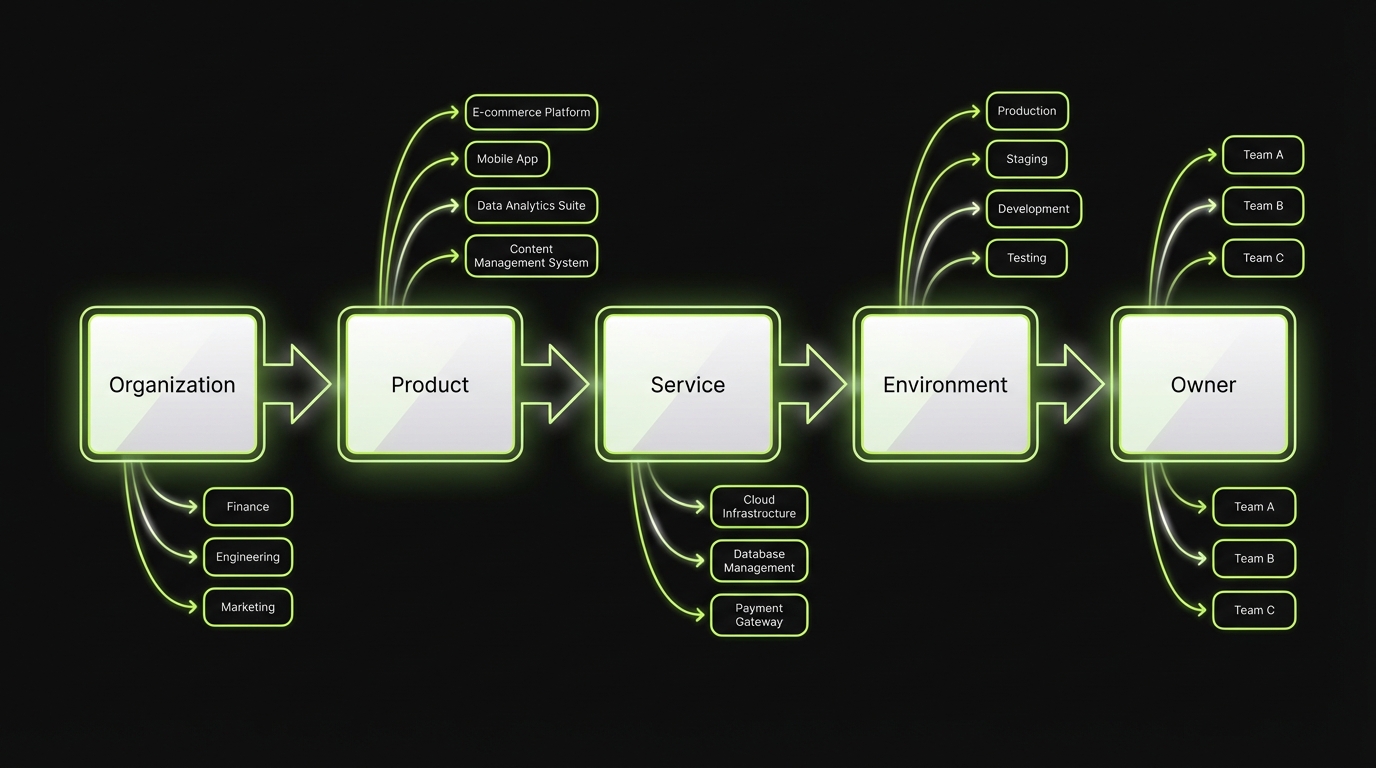
Allocation model and reporting boundaries
Pick one model and document it.
Common allocation choices:
- Direct allocation: resource tags map spend to a team
- Shared platform split: platform costs distributed by usage (requests, CPU seconds, GB processed)
- Overhead bucket: keep some costs centralized, but cap it
A pragmatic rule:
- If a team can change it in a sprint, allocate it to them.
- If nobody can change it quickly (enterprise contracts, base networking), keep it centralized but visible.
What fails:
- Tagging only at the account level
- “Shared” as a default value
- Chargeback without engineering context, which turns into blame instead of action
Rightsizing and scheduling strategies
Rightsizing is the fastest win for steady workloads. Scheduling is the fastest win for non production.
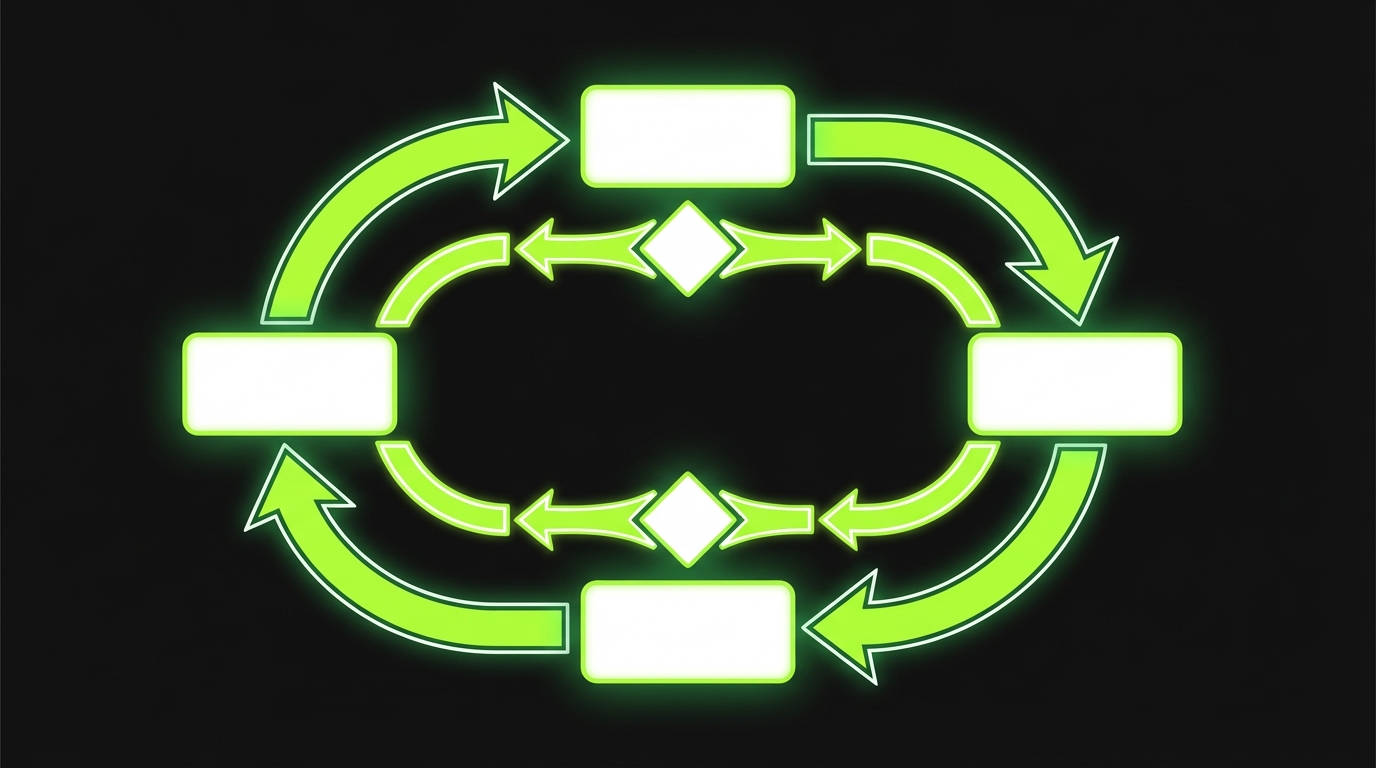
Daily Cost Anomaly Loop
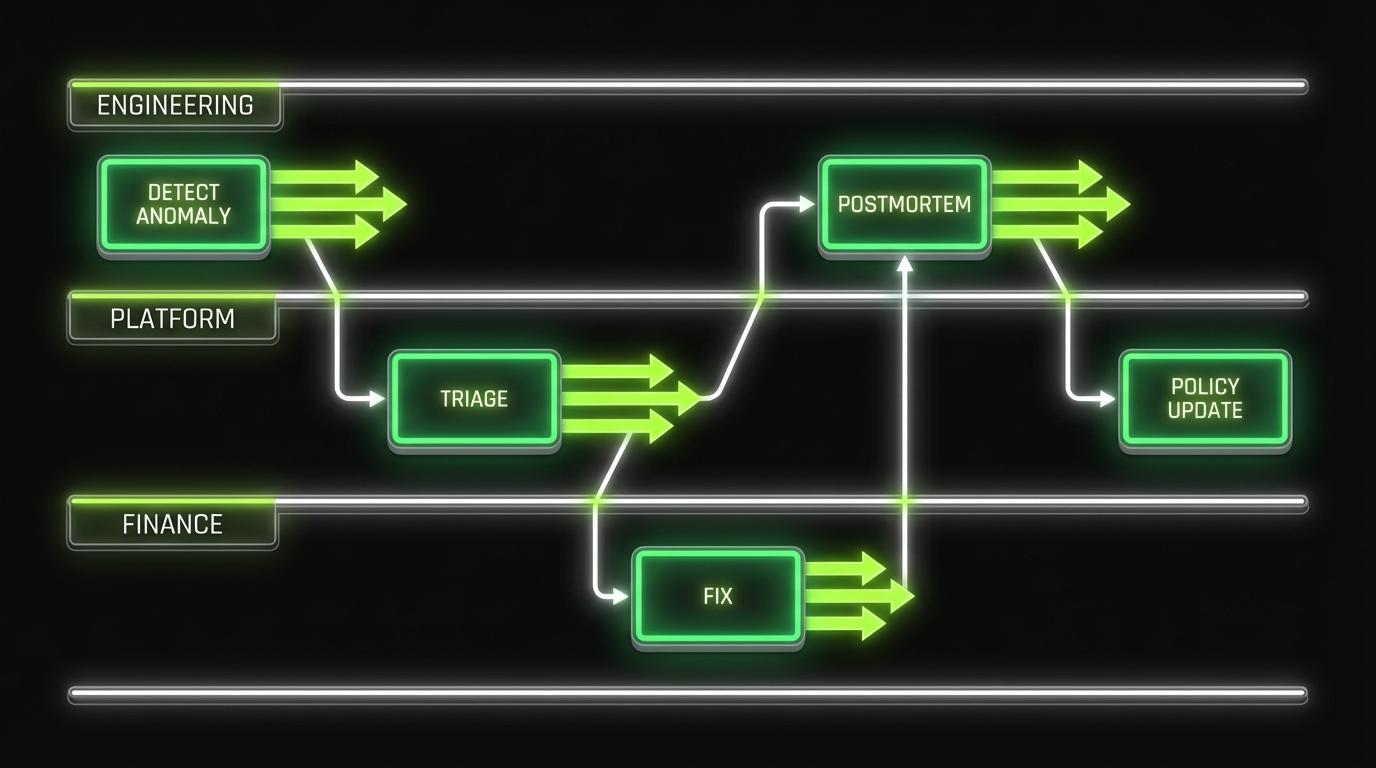
Governance that sticksOptimization without governance is temporary. Run daily anomaly detection; weekly is too slow for fast moving teams and you will miss most runaway spend. Minimum system:
- Alert on spend deltas by team and service (not just total bill).
- Auto-assign an owner from tags. Require a short “cause + fix” note.
- Add a lightweight review cadence: top anomalies, what changed in code or config, and one policy update.
What fails: alerts with no owner and no follow-up. Mitigation: tie alerts to a ticket with an SLA, and treat repeated issues like reliability regressions (postmortem, then a guardrail).
Do both. In that order.
- Rightsizing reduces baseline spend
- Scheduling removes waste you never needed
Example: In teams shipping customer apps and SaaS platforms, we often see dev and staging run 24/7 by accident. Turning that off is usually the first clean savings move because it has low product risk.
Here’s a practical way to run it without creating outages.
Rightsizing without outages
Start with the top spenders. Don’t boil the ocean.
- Rank resources by cost (last 30 days)
- Pull utilization (CPU, memory, IOPS, connections)
- Pick a target band (example: 40% to 60% peak utilization)
- Change one variable at a time (instance size, node count, DB class)
- Watch error rates and latency for 24 to 72 hours
A quick decision table:
| Signal | Likely action | Risk | Mitigation |
|---|---|---|---|
| CPU < 10% and flat | Downsize | Low | Roll back plan |
| CPU spikes with latency | Autoscale or cache | Medium | Load test |
| Memory near limit | Don’t downsize | High | Fix memory first |
| DB connections maxing | Pooling or scale up | High | Tune app and DB |
What fails:
- Rightsizing based on average CPU only
- Ignoring memory and network
- Changing many services at once so you can’t attribute impact
Scheduling that engineers accept
Scheduling fails when it’s manual or when it breaks someone’s workflow.
Make it boring and predictable:
- Auto stop dev and staging at a fixed hour
- Auto start before the workday
- Allow a self service “keep alive” label for late work
- Log every stop and start event to a shared channel
Scheduling targets:
- Dev, staging, preview environments
- Batch workers not tied to user traffic
- Non critical analytics jobs
If you need a first pass policy:
- Stop non prod for 12 hours a day on weekdays
- Stop non prod for 48 hours on weekends
That alone can remove a big chunk of waste. Measure it and keep the policy if nobody complains.
Allocation first
Tagging discipline
Make spend attributable to teams and services so decisions are fair and fast.
Optimize in layers
Baseline then architecture
Rightsize and schedule first, then autoscaling, caching, and workload profiling.
Governance that ships
Lightweight rituals
Weekly anomaly reviews and monthly unit economics keep savings from drifting back.
Dashboard structure that engineers use
_> A reporting template you can ship in a day
Spend by service
Top services by cost with week over week and month over month deltas, tied to owners.
Unit economics view
Cost per request, cost per job, or cost per active user. Pick one per product and stick to it.
Change correlation
Overlay deploys, scaling events, and config changes to explain cost movement.
Anomaly inbox
Daily detection with routing rules to the owning team, with severity based on budget impact.
Waste radar
Idle resources, low utilization instances, old snapshots, and unused IPs with owners and age.
Forecast and commitments
Coverage and utilization for reserved capacity, plus forecast error so finance can trust the numbers.
Autoscaling, caching, and workload profiling
Rightsizing and scheduling handle the obvious waste. The next layer is architectural: scale with demand, reduce repeated work, and understand what your workloads actually do.
Rightsize Then Schedule
Fast wins, low riskDo rightsizing first (cuts baseline), then scheduling (removes hours you never needed). This order reduces the chance you schedule an already underprovisioned system into failures. Practical runbook:
- Start with the top 10 compute spenders. Compare peak CPU and memory vs requests and limits.
- Apply one change per service. Watch error rate and latency for 24 to 72 hours.
- For non production, schedule off-hours shutdown. Common miss: dev and staging running 24/7 by accident.
What fails: aggressive downsizing without guardrails. Mitigation: set rollback thresholds (latency, OOM kills, autoscaling churn) and keep changes small.
Three moves matter most:
- Autoscaling to match traffic patterns
- Caching to avoid repeated compute and egress
- Workload profiling to find hot paths and expensive queries
Insight: If you don’t profile, you’ll optimize the wrong thing. Teams often spend weeks on instance tuning when one endpoint or query is the real bill.
Autoscaling with guardrails
Autoscaling is not “set it and forget it.” It’s a control system.
Checklist for production ready autoscaling:
- Scale on a leading indicator (queue depth, requests per second), not just CPU
- Set min and max bounds per service
- Use step scaling or target tracking with sane cooldowns
- Make scale events visible in logs and dashboards
Common failure modes:
- Scaling on CPU for IO bound services
- No max cap, so a bug becomes a cost incident
- Cold starts that turn scaling into latency spikes
Mitigation:
- Load tests that include scale up and scale down
- Per service budgets and alarms tied to scaling events
Caching that reduces AWS costs
Caching is a cost tool and a reliability tool.
Places caching usually pays off:
- CDN caching for static assets and public pages
- API response caching for read heavy endpoints
- Database query caching for expensive aggregations
What to measure:
- Cache hit rate
- P95 latency before and after
- Origin request volume
- Egress volume
A simple cache policy table:
| Data type | TTL starting point | Invalidation strategy | Watch outs |
|---|---|---|---|
| Product catalog | 5 to 15 minutes | Event based | Stale prices |
| User profile | 30 to 120 seconds | Write through | Privacy and auth |
| Search results | 30 to 300 seconds | Keyed by query | Cache stampede |
In performance heavy products like video platforms, caching often becomes a first class part of the architecture. It helps both cost and user experience.
Workload profiling that finds the money
Profiling is where you stop guessing.
Start with these questions:
- Which endpoints drive the most compute seconds?
- Which background jobs run the longest?
- Which tenants or customers are outliers?
Practical methods:
- Sampled tracing on top endpoints
- Query plans for top database queries
- Per job duration and retries for workers
When we build large scale experiences, the pattern is consistent: a small number of paths drive most of the cost. Find those paths. Fix those paths. Then repeat.
Common cost anti patterns
What we see right before a cost incidentUse this list as a review checklist during incidents and postmortems.
- No max cap on autoscaling
- Logging set to debug in production for weeks
- Cross region data transfer hidden inside “shared networking”
- Multiple teams running duplicate observability stacks
- Preview environments that never get deleted
- “Temporary” load tests running against production resources
- Databases scaled up for a one off migration and never scaled down
Mitigation pattern:
- Add a guardrail (policy, quota, alert)
- Add an owner (team, on call alias)
- Add a runbook (how to roll back safely)
- Add a metric (so you know it worked)
What good looks like
_> Outcomes you can measure without guessing
Faster cost answers
You can explain spend changes with owners, deploy IDs, and next actions in under 10 minutes.
Lower baseline spend
Steady workloads run closer to the needed capacity, with headroom defined by SLOs not fear.
Fewer cost incidents
Anomalies are detected daily, capped by quotas, and resolved with runbooks and postmortems.
Less team friction
Engineers keep autonomy because guardrails are automated and predictable, not manual approvals.
Observability driven optimization and governance
Optimization without governance is a temporary discount.
Allocation Before Optimization
Make spend explainableMaturity gate: if you cannot attribute 80% of spend to an owner, optimization stalls. Treat this like a release blocker. Action checklist:
- Enforce mandatory tags at creation (owner, product, service, env).
- Ship IaC defaults so tagging is not optional.
- Track an unallocated spend SLO (target trend to zero; alert when it regresses).
What fails: “shared” buckets and best effort tagging. Mitigation: block untagged resources in CI or at provisioning, and publish a weekly list of top unallocated items with owners assigned.
You need a system that:
- Detects cost anomalies fast
- Connects spend to changes in code and config
- Assigns ownership automatically
- Keeps teams honest without slowing delivery
This is where observability meets FinOps.
Key stat: If your cost anomaly detection runs weekly, you will miss most runaway spend. Daily is a better default for fast moving teams.
Dashboards that answer real questions
A cost dashboard should answer questions engineers actually ask.
Start with four views:
- Spend by owner (team, service)
- Unit economics (cost per request, cost per active user, cost per job)
- Change correlation (deploys, config changes, scaling events)
- Anomalies (day over day, week over week)
Reporting template (copy this into your wiki):
- Period: last 7 days, last 30 days
- Total spend: $X
- Top 5 services by spend: list with deltas
- Top 5 changes correlated with spend: deploy IDs, config diffs
- Savings shipped: what changed, expected monthly impact
- Open risks: what might increase spend next
If you can’t tie cost movement to a change log, add that instrumentation first.
Governance model and ownership
Keep governance lightweight. Make it consistent.
A model that works for many orgs:
- Finance: sets budgets, reporting requirements, allocation rules
- Platform team: enforces tagging, policies, guardrails, shared tooling
- Product engineering teams: own service level spend and optimization backlog
Cadence:
- Weekly: anomaly review (30 minutes)
- Monthly: allocation and unit economics review (60 minutes)
- Quarterly: reserved capacity and architecture review (half day)
Ownership rules:
- Every service has an engineering owner and a budget owner
- Every anomaly has a ticket and a due date
- “Shared” costs have a named platform owner
In Apptension delivery teams, we’ve seen governance succeed when it is treated like reliability work. Same rituals. Same clarity. No drama.
Conclusion
Cloud cost optimization at scale is not one trick. It’s a stack.
Start with allocation so you can see. Then remove waste fast. Then improve architecture where it matters. Finally, lock it in with governance.
Actionable next steps for the next 14 days:
- Pick a tagging spec and enforce it in IaC
- Build the first dashboard: spend by team, by service, with deltas
- Run rightsizing on the top 10 compute spenders
- Schedule non production to stop outside work hours
- Add anomaly detection and a weekly review
Insight: The best FinOps playbook is the one your engineers can run without asking permission.
If you want a simple success metric, use this: can you explain last week’s spend change in 10 minutes, with owners and next actions? If not, fix visibility and governance before chasing micro optimizations.