Direct answer
Tool roundups help shortlist vendors. They do not ship your SaaS. Use this comparison to cut options, then hire senior engineers who integrate the winner into production. See React / Next.js expertise.
Introduction
Most SaaS teams don’t fail at analytics because they picked the “wrong tool”. They fail because they never align on what they’re trying to learn, who owns the tracking plan, and how they’ll trust the data when it starts driving roadmap decisions.
Amplitude, Mixpanel, and Heap are all solid product analytics tools for SaaS companies. They overlap a lot. The differences show up once you have:
- Multiple teams shipping in parallel
- A messy event taxonomy
- A mix of product led growth and sales led motion
- Pressure to answer questions fast, without breaking privacy rules
Insight: If you can’t explain your key events in plain language, switching tools won’t save you.
Here’s how we think about the tradeoffs, based on what we’ve seen while building SaaS products, data heavy platforms, and AI assisted tools (including analytics and visualization work like mTab, and an AI driven analysis workflow for L.E.D.A.).
What this article covers (and what it doesn’t)
We’ll compare Amplitude vs Mixpanel vs Heap for day to day product analytics work:
- Instrumentation effort and governance
- Funnels, retention, and segmentation workflows
- Data quality and debugging
- Collaboration patterns for product, engineering, and data
- Practical implementation steps
We won’t do a feature checklist of every plan tier. Pricing changes too often. Instead, we’ll focus on the decisions that tend to stick for years.
What SaaS teams actually need from product analytics
Before the tool, you need a job to be done. In SaaS, the job is usually one of these:
- Reduce time to activation
- Improve retention in a specific cohort
- Increase conversion from free to paid
- Understand why a feature is ignored or misused
- Catch a broken release before support tickets pile up
The trap is trying to answer all of them at once with vague tracking.
Key Stat (hypothesis): In most SaaS teams we’ve worked with, the first tracking plan version misses at least 20 to 40 percent of the events needed to explain churn. Measure this by sampling churned accounts and checking whether you can reconstruct their last 7 days of product activity.
Bullets you can use as a quick gut check:
- If your activation is unclear, you need clean funnels and onboarding segmentation
- If retention is the problem, you need cohort retention you can trust and slice fast
- If adoption is the issue, you need feature level usage, not just page views
- If your org is regulated, you need privacy controls and a sane data access model
Common failure modes (and how to mitigate them)
These show up regardless of whether you pick Amplitude, Mixpanel, or Heap:
- Event sprawl: 300 events, nobody knows which ones matter
- Mitigation: define 10 to 20 core events that map to the product narrative
- Naming drift: “signup”, “sign up”, “create account” all mean different things
- Mitigation: a single tracking spec and a review step in PRs
- No ownership: analytics becomes “everyone’s job”, so it’s nobody’s job
- Mitigation: one DRI for taxonomy and quality checks
- Data trust collapse: one bad dashboard and the team stops using analytics
- Mitigation: add validation queries and a weekly spot check routine
Insight: The fastest way to kill analytics adoption is to ship dashboards before you ship definitions.
Speed to insight
How fast you can answer questions
If you need answers this week, prioritize low friction setup and simple reporting. You can add rigor later, but only if you plan for it.
Data trust
Whether people believe the numbers
If analytics will drive roadmap bets, invest in definitions, ownership, and validation. Otherwise you’ll optimize the wrong thing confidently.
Governance
How you avoid taxonomy chaos
The more squads you have, the more you need consistent naming, access controls, and a way to deprecate events without breaking dashboards.
Amplitude vs Mixpanel vs Heap: the practical differences
All three can do funnels, retention, cohorts, and segmentation. The differences show up in how you get data in, how you debug it, and how hard it is to keep the system clean after six months.
Here’s a comparison table you can actually use in a decision meeting.
| Category | Amplitude | Mixpanel | Heap |
|---|---|---|---|
| Best fit | Product teams that want deep behavioral analysis and governance | Teams that want fast answers with strong event based reporting | Teams that want to start quickly with auto capture and less upfront instrumentation |
| Instrumentation approach | Mostly explicit event tracking, with strong taxonomy discipline | Explicit event tracking, usually lighter governance than Amplitude | Auto capture plus optional custom events and definitions |
| Funnels and retention | Very strong, especially for complex journeys | Very strong, fast to iterate | Good, but depends on how well you define and curate captured data |
| Data hygiene risk | Lower if you enforce standards, higher if you don’t | Medium, depends on tracking plan discipline | Higher early on due to volume and noise from auto capture |
| Debugging workflows | Strong, but requires process | Strong, often straightforward for PMs | Can be tricky when “everything is captured” but meaning is unclear |
| Learning curve | Medium to high | Medium | Low to medium |
| Collaboration model | Works well when product, data, and engineering share ownership | Works well for product led teams moving fast | Works well for small teams, riskier as teams scale without governance |
Insight: Heap can feel like you skipped the tracking plan. You didn’t. You just postponed it.
Quick bullets if you need a one minute summary:
- Pick Amplitude when you want rigor and expect analytics to drive big roadmap bets
- Pick Mixpanel when you want speed, strong core reports, and broad PM adoption
- Pick Heap when you want to learn fast with minimal engineering time, and you’re willing to invest later in curation
Amplitude: when rigor is the feature
Amplitude tends to win when teams treat product analytics as a system, not a set of charts.
What works well:
- Behavioral analysis depth: easy to slice cohorts and compare paths
- Governance friendly: better fit when multiple squads ship events
- Long term consistency: if you keep taxonomy clean, analysis stays usable
What can fail:
- The tool won’t prevent bad instrumentation. It will just make it easier to create more dashboards.
- Teams can over analyze. You get 12 retention charts and no decision.
Mitigation ideas:
- Create a weekly “decision review”: one insight, one decision, one follow up metric
- Maintain a small set of canonical dashboards tied to OKRs
Mixpanel: fast answers with event discipline
Mixpanel is often the sweet spot for SaaS companies that want strong product analytics without building a full data team upfront.
What works well:
- Funnels and retention are quick to iterate
- Good day to day usability for PMs and growth teams
- Strong segmentation patterns for product led growth
What can fail:
- If engineering ships events without a spec, you end up with a junk drawer taxonomy.
- Teams sometimes treat Mixpanel as the source of truth for revenue metrics. That usually backfires.
Mitigation ideas:
- Keep billing and revenue metrics in your data warehouse or billing system, then link cohorts back to product behavior
- Add a lightweight “event review” step to your release checklist
Heap: great for speed, risky for scale without curation
Heap’s auto capture is the main reason teams choose it. It reduces the upfront engineering cost of “we need to start measuring yesterday”.
What works well:
- Time to first insight is low
- Useful when you’re still figuring out what matters
- Great for UI interaction questions, especially early in a product
What can fail:
- Auto captured data becomes noisy fast. You can drown in clicks.
- Definitions drift when different people create similar events.
Mitigation ideas:
- Treat Heap like an intake layer. Curate a smaller semantic event set that maps to user intent
- Lock down who can create definitions once you hit a certain team size
Key Stat (hypothesis): Expect a spike in “analysis time” after 60 to 90 days if you rely heavily on auto capture without a curation process. Measure time from question asked to answer delivered, and track it weekly.
Implementation strategy that doesn’t collapse in month three
Tool choice matters less than the implementation pattern. We’ve seen teams with the best tool still fail because they treated tracking as a one off task.
Here’s a simple process that holds up when you scale from MVP to “we ship weekly and have multiple squads”. It lines up with the same shift we talk about when moving from startup hustle to startup muscle: you can’t run on ad hoc forever.
A step by step rollout (practical and boring, in a good way)
Define the product narrative
- What is activation?
- What are the 3 behaviors that predict retention?
- What is the paid conversion moment?
Write a tracking plan that fits on two pages
- 10 to 20 core events
- Clear properties (account_id, plan, role, feature flags)
- Naming rules
Instrument and validate
- Add unit tests where possible
- Add a QA checklist for analytics in UAT
Ship canonical dashboards
- One activation funnel
- One retention view
- One feature adoption report
Create a weekly analytics rhythm
- 30 minutes
- One question
- One decision
- One follow up metric
Bulleted checks we use in delivery:
- Every event has an owner
- Every dashboard has a decision it supports
- Every metric has a definition and a data source
Insight: If analytics is not part of UAT, you’re shipping blind.
Below is an example of what an event spec can look like in practice.
Example: event tracking spec snippet (what engineers can implement)
{
  "event": "feature_used",
  "description": "User successfully completes a core action in the feature",
  "properties": {
    "user_id": "string",
    "account_id": "string",
    "feature_name": "string",
    "plan": "free|pro|enterprise",
    "result": "success|error",
    "error_code": "string|null",
    "experiment_variant": "string|null"
  },
  "triggers": [
    "After server confirms success",
    "Not on button click"
  ]
}
Where teams should be strict vs flexible
Be strict about:
- Identity: user_id vs account_id, and how you handle merges
- Core events: activation, key feature usage, upgrade, churn signals
- Server side truth: anything tied to permissions, billing, or success criteria
Be flexible about:
- Exploratory UI events early in the product
- Temporary experiment events, as long as they have an expiration date
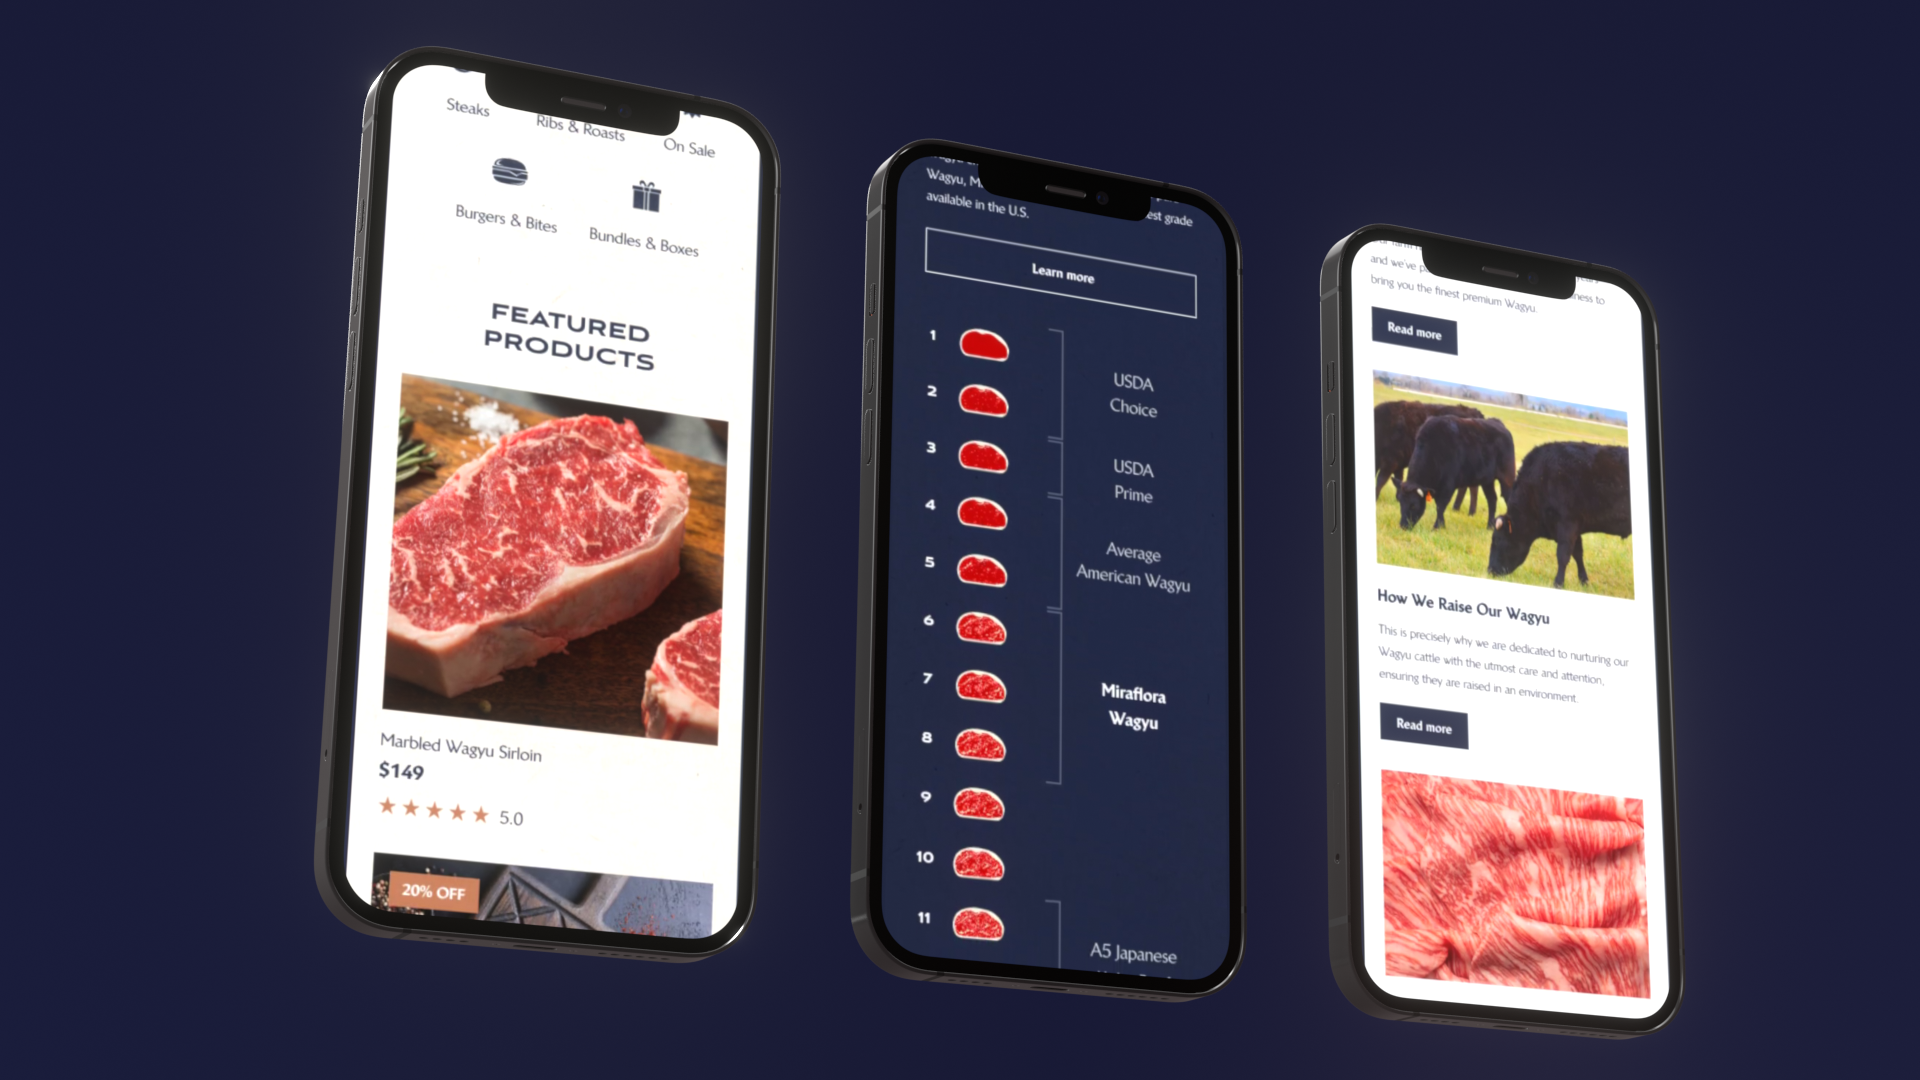
Example: In fast turnaround builds like Miraflora Wagyu (delivered in 4 weeks across time zones), the only way to keep decisions moving is to agree on what “done” means. Analytics definitions work the same way. If you can’t align asynchronously, you get drift.
Even when the domain is different, the pattern repeats: teams want answers they can defend.
Here are a few concrete patterns that translate well to SaaS product analytics.
- Start from decisions, not dashboards
- Example decisions: “Do we keep this onboarding step?” “Do we gate this feature?”
- Prefer server side events for anything that can be disputed
- “User clicked” is not the same as “user successfully completed”
- Treat definitions like product surface area
- Version them. Review them. Deprecate them.
Example: In L.E.D.A. (10 weeks), the hard part wasn’t generating answers. It was making the system reliable enough that analysts could trust it. Product analytics is similar. If your funnel is wrong, you’ll optimize the wrong step.
What to measure first (if you’re overwhelmed)
Pick one goal. Then measure only what you need to move it.
- Activation
- Time to first value
- Drop off by step
- Activation rate by acquisition channel
- Retention
- Week 1 and week 4 retention by cohort
- Feature usage frequency
- Monetization
- Upgrade conversion by cohort
- Feature usage in the 7 days before upgrade
Key Stat (hypothesis): Track “time to first value” as a median, not an average. The average gets distorted by edge cases. Validate by comparing median vs mean and checking which correlates better with week 4 retention.
A note on AI features and analytics (yes, it changes the plan)
If you ship AI powered features, you need extra properties and a different mindset. In generative AI builds, we usually add:
- Model version
- Prompt template version
- Safety filter outcomes
- Latency buckets
- User feedback (thumbs up or down, edits, retries)
Why? Because “feature used” is not enough. You need to know if the output was useful and safe.
Mitigation for noise:
- Sample high volume events
- Store raw prompts only when policy allows it
- Keep a redaction layer between product analytics and sensitive text
This is where a Generative AI Solutions style approach helps: treat compliance and observability as first class requirements, not afterthoughts.
Conclusion
Amplitude vs Mixpanel vs Heap isn’t a beauty contest. It’s a trade between speed, governance, and how much ambiguity your team can tolerate.
If you want a simple way to decide, use this:
- Choose Heap if you need to learn fast with minimal engineering effort, and you’re willing to invest later in curation
- Choose Mixpanel if you want strong product analytics that most PMs can use daily with a reasonable tracking plan
- Choose Amplitude if you expect analytics to drive high stakes decisions and you can enforce taxonomy and ownership
Next steps you can do this week:
- Write down your activation definition in one sentence
- List the 10 events that explain your user journey
- Pick one funnel and validate it end to end (client and server)
- Set a weekly cadence: one question, one decision, one metric
Insight: The best SaaS product analytics tool is the one your team trusts enough to argue with.
Need help shipping the product behind the analytics?
Tool choice only matters if the product ships. See SaaS development and React and Next.js expertise, or start from the SaaS Boilerplate.