The first MRR dip is not bad luck. It is math.
A long growth streak builds a story in your head: “We figured it out.” Then one month ends and MRR is down. The initial reaction is emotional because it feels like a verdict on the product, the team, and the roadmap. That reaction is normal, but it is not useful.
In most subscription businesses, the first dip is not random. It is what happens when acquisition stops accelerating while churn keeps doing its quiet work. If new MRR stays flat for a few months and churn creeps from 2% to 3%, momentum eventually flips. The dip is the moment the system’s hidden debt shows up on the dashboard.
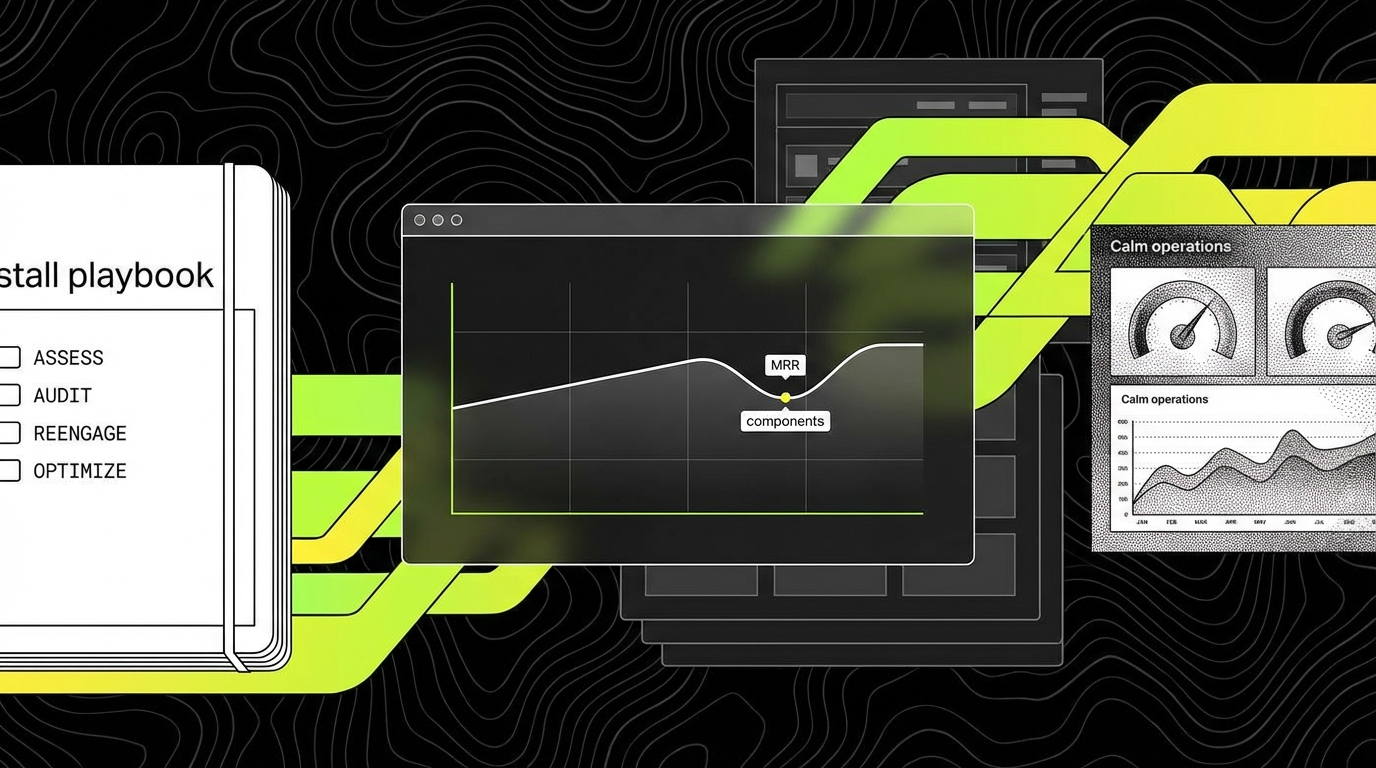
This article is an operations guide. We will separate feelings from facts, validate the numbers, and locate the break in the funnel: channel → activation → retention → expansion. Then we will turn the diagnosis into a repeatable stall playbook: metrics to watch, questions to ask, experiments to run, and panic moves to avoid.
Start by validating the data (before you “fix” anything)
When MRR dips, teams often jump straight to solutions: “We need a new feature,” “We need a rebrand,” “We need more ads.” That is expensive if the dip is partly a measurement problem. Before you change the product, confirm that your MRR and churn numbers are computed the same way month to month.
MRR gets messy because it is not one number. It is a set of movements that can cancel each other out. A healthy diagnosis splits MRR into at least four components: New MRR (from first time subscribers), Expansion MRR (upgrades, seat growth), Contraction MRR (downgrades), and Churned MRR (cancellations). If your “MRR dip” is mostly contraction, you have a different problem than if it is mostly logo churn.
Define the metrics you will use (and stick to them)
Agree on definitions in writing and keep them stable for the quarter. For example, logo churn is the percentage of customers who cancel in a period, while revenue churn is the percentage of MRR lost. A B2B SaaS can have low logo churn (few customers leave) but high revenue churn (one large account downgrades). Those demand different fixes.
Also separate gross revenue retention (GRR) from net revenue retention (NRR). GRR answers: “How much of last month’s MRR did we keep before expansion?” NRR answers: “After expansion and contraction, did existing customers grow?” As a concrete example, if you start the month with $100k MRR, lose $6k to churn, lose $4k to downgrades, and gain $12k in upgrades, your GRR is 90% and your NRR is 102%. A dip with NRR above 100% usually points to acquisition, not retention.
Check for false dips caused by billing and attribution
Some “dips” are artifacts: annual plans recognized monthly, invoices paid late, refunds processed in batches, or plan migrations that temporarily misclassify expansion as new MRR. Even a small instrumentation change can shift numbers. If you recently switched billing providers, changed your pricing model, or merged product lines, validate the mapping from subscription events to MRR movements.
At Apptension, we have seen teams chase churn fixes for weeks when the real issue was event timing: cancellations were recorded at the start of the period instead of the end, inflating churn in one month and deflating it in the next. The fix was not a feature. It was a consistent “effective date” rule for subscription state changes.
Find where the system is breaking: channel → activation → retention → expansion
Once the numbers are real, treat the business like a pipeline. Money enters through acquisition channels, turns into active users through activation, stays through retention, and grows through expansion. A dip means one or more stages weakened enough that the whole system can’t compensate.
The fastest way to waste time is to look at the funnel as one blob. Instead, ask: “Which stage changed first?” For example, if trial starts are stable but paid conversions dropped, the break is likely activation or pricing. If conversions are stable but churn rose in cohorts that are 2 - 3 months old, the break is retention and time to value.

Channel: measure what each channel actually produces
Channel performance is not “traffic.” It is qualified signups and new MRR by source. Concrete metrics that help: trial to paid conversion rate by channel, CAC (customer acquisition cost) by channel, and payback period (months to recover CAC from gross margin). A channel can look good on clicks and still be bad if it brings low intent users who churn in 30 days.
Example: paid search might drive 500 trials at a 6% conversion rate, while partnerships drive 80 trials at a 20% conversion rate. If the partnership cohort has 2% monthly revenue churn and paid search has 6%, the “smaller” channel is often the better system input. The dip can start when the mix shifts toward weaker channels.
Activation: identify the “value moment” and measure it
Activation is not “they signed up.” Activation is “they reached the first value moment.” The value moment is the specific action that makes the user say, “This is worth paying for.” It must be observable. In a scheduling tool it might be “created first bookable link and received a booking.” In a B2B dashboard it might be “connected a data source and generated the first report.”
Measure activation with a clear event and a time window, such as: “% of new accounts that connect an integration within 24 hours” or “median time from signup to first successful export.” If activation rate drops from 45% to 30%, churn will rise later. The dip is just the delayed symptom.
Retention: cohort curves tell you if you have a leak or a mismatch
Retention is where most “first dip” stories end up. Look at cohort retention curves by signup month. A leak looks like a consistent drop at a specific age, such as many customers leaving around day 30 when the first renewal hits. A mismatch looks like newer cohorts retaining worse than older cohorts, often because positioning changed, a new channel brought a different ICP, or onboarding drifted.
Use concrete retention metrics: 30 day logo retention, 90 day revenue retention, and churn hazard by week (the probability of churn at week N given they are still active). If customers churn mostly in weeks 2 - 4, you likely have a time to value problem. If they churn in months 6 - 9, you may have a product ceiling or missing advanced workflows.
Expansion: separate “happy growth” from “forced upgrades”
Expansion MRR can hide problems. If upgrades come from real usage growth, that is healthy. If upgrades come from hitting limits that feel arbitrary, you may get short term expansion and long term churn. Track expansion drivers: seat growth, usage based overages, add-on adoption, and plan upgrades triggered by feature needs.
Concrete checks: expansion rate by cohort, and “upgrade then churn within 60 days” rate. If many accounts upgrade and then churn soon after, it can mean pricing friction, unclear packaging, or customers upgrading out of confusion rather than value.
Churn segmentation: stop treating churn as one number
“Churn is up” is not a diagnosis. It is a symptom. Churn segmentation turns the symptom into a set of smaller, solvable problems. The goal is to answer three questions: who is leaving, when they leave, and why they leave in their own words.
Start with a churn table that includes at least: plan, MRR, tenure (days active), acquisition source, industry, company size, key feature usage counts, support tickets, and last active date. Even if your data is imperfect, patterns show up quickly when you slice it.

Segment churn by tenure (early, mid, late)
Tenure is the simplest segmentation and often the most revealing. Early churn (first 30 - 60 days) usually points to onboarding, unclear value, or wrong expectations set by marketing. Mid churn (2 - 6 months) often points to missing workflows, weak habit formation, or a competitor that wins on one key feature. Late churn (6+ months) can be budget cycles, internal champion changes, or the product not keeping up with growing needs.
Make it concrete by setting buckets that match your billing cycle. For monthly plans: day 0 - 30, 31 - 90, 91 - 180, 181+. For annual plans: 0 - 90, 91 - 180, 181 - 365, renewal window. Then compute churn rate and churned MRR for each bucket. A spike in the renewal window is a different playbook than a spike in the first month.
Segment churn by ICP fit and use case
ICP fit is not a slogan. It is a set of observable traits: industry, team size, budget range, tech stack, compliance needs, and the job to be done. If churn clusters in “small teams under 5 people” while “teams 20 - 100” retain well, you might have an ICP mismatch created by a new channel or a pricing change.
Also segment by use case. Two customers can pay the same plan and still have different retention drivers. For example, one cohort uses your tool for weekly reporting, another uses it for incident response. The first needs templates and scheduling. The second needs integrations and reliability. If you ship features for one use case while acquiring the other, churn rises even though the product “improves.”
Segment churn by “value moment reached” (or never reached)
This is the most practical segmentation because it connects churn to product behavior. Define 1 - 3 activation milestones that represent value, then tag churned accounts by whether they hit them. Examples: “connected integration,” “invited teammate,” “completed first workflow,” “ran first export,” “configured alerts,” depending on your product.
If 70% of churned accounts never reached milestone #1, the fix is not more advanced features. It is onboarding, messaging, and reducing setup friction. If most churned accounts reached milestones but stopped using a core feature, the fix is retention: reminders, better defaults, and workflows that create repeated value.
Customer conversations: get the story behind the numbers
Dashboards tell you what happened. Customers tell you why it happened. When MRR dips, you need both. The goal of churn interviews is not to “win them back” on the call. It is to understand the mismatch between what they expected and what they got.
Talk to three groups: (1) customers who churned in the last 30 days, (2) customers who considered churning but stayed (support tickets, downgrade attempts), and (3) your best retained customers in the same segment. Comparing these groups helps you avoid building for edge cases.
Ask questions that produce specific, testable answers
Good churn questions anchor on events and decisions, not opinions. Instead of “What did you think of the product?” ask “What were you trying to do in the first week?” and “What happened right before you canceled?” You are looking for a timeline: expectation → attempt → friction → workaround → cancellation.
Use a consistent script and capture answers in a structured way. Here are questions that tend to produce practical output:
- Trigger: “What changed in your business that made you look for a tool like this?”
- Success criteria: “What would have made this a clear win after 30 days?”
- Value moment: “When did you first get value, if ever? What did that look like?”
- Friction: “Where did you get stuck? Setup, data import, permissions, integrations, reporting?”
- Alternatives: “What did you switch to, or what workaround are you using now?”
- Pricing: “Was price the reason, or was price the excuse for missing value?”
Translate qualitative feedback into operational categories
Raw feedback is noisy. Turn it into categories you can measure. Common categories include: “time to first value too long,” “missing key integration,” “role based access control needed,” “reporting not trusted,” “too complex for small teams,” “support response time,” and “pricing not aligned with usage.” Each category should map to an owner and a metric.
For example, if customers say “I couldn’t trust the numbers,” that is not a vague complaint. It can map to data freshness (how often data sync runs), data accuracy (percentage of records that match source of truth), and incident rate (number of data pipeline failures per week). If they say “setup took forever,” map it to median onboarding completion time and drop off rate per onboarding step.

Choose one focused path (and run it as experiments)
After diagnosis, teams often try to fix everything at once. That creates scattered feature shipping: lots of output, little impact, and no clear learning. A better approach is to pick one primary path for the next 4 - 8 weeks, then run disciplined experiments with measurable success criteria.
There are four common paths after a first MRR dip. Each is valid in the right situation. Each fails when you choose it for emotional reasons instead of data.
Path 1: Plug the retention leak
Choose this path when churn segmentation shows a clear leak (for example, churn spikes at day 30) and when acquisition is stable. Retention work is often unglamorous: onboarding, defaults, lifecycle messaging, reliability, and support. It is also often the fastest way to stop the bleeding.
Concrete experiments for retention:
- Onboarding compression: remove steps until the user can reach value in under 10 minutes. Measure median time to first value and activation rate.
- Lifecycle nudges: send an in app prompt when a user stalls (for example, no integration connected after 24 hours). Measure reactivation rate and week 4 retention.
- Reliability fixes: if the product fails silently, add alerts and visible status. Measure incident count, MTTR (mean time to recover), and churn in affected cohorts.
Path 2: Rework positioning and ICP
Choose this path when churn clusters in a segment that you recently started attracting, or when interviews show expectation mismatch. Positioning is not a tagline. It is the promise you make and the tradeoffs you accept. If you claim “simple for anyone” but your product requires integrations and admin setup, you will attract the wrong customers and churn will rise.
Concrete experiments for positioning:
- Landing page message test: change the headline from a broad claim to a specific job to be done (for example, “weekly client reporting in 15 minutes”). Measure trial to activation rate and early churn.
- Qualification gate: add a question in signup like “Do you have a data source to connect today?” Measure activation rate and support ticket volume per new account.
- Sales script change: explicitly state who it is not for. Measure close rate and 90 day retention of new customers.
Path 3: Adjust pricing and packaging
Choose this path when interviews show value but pricing feels misaligned, or when contraction MRR is the main driver. Pricing problems show up as downgrades, discount pressure, and customers “using less” to fit a plan. Packaging problems show up as customers paying for features they do not need or hitting limits that block basic use.
Concrete experiments for pricing and packaging:
- Plan simplification: reduce plan count and make the upgrade path obvious. Measure conversion rate and upgrade rate, but also support tickets tagged “billing confusion.”
- Value metric change: move from seats to usage (or the other way) if it matches how customers get value. Measure expansion rate and churn among fast growing accounts.
- Grandfathering test: keep existing customers on old pricing and test new pricing only on new signups. Measure new MRR and churn without risking your base.
Path 4: Open a new acquisition channel (carefully)
Choose this path when retention is stable (for example, GRR steady and cohort curves healthy) but new MRR is flat. Adding channels is not “do more marketing.” Each channel has a different intent profile and sales cycle. If you add a channel that brings low intent users, you can worsen churn and still fail to grow.
Concrete experiments for acquisition:
- Channel pilot: run one channel for 4 weeks with a fixed budget. Measure CAC, trial to activation, and 30 day retention for that cohort.
- Partner co selling: test a referral motion with a tool your ICP already uses. Measure lead to close rate and average contract value.
- Outbound to a narrow list: 100 accounts that match ICP traits (industry, size, stack). Measure reply rate, meeting rate, and close rate, not just volume.
The stall playbook: a repeatable response to an MRR dip
A dip is stressful because it feels like a one time crisis. Treat it as a drill instead. The goal is to build a repeatable playbook your team can run every time growth stalls. That reduces panic and increases learning.
Below is a practical checklist you can run in a week, then turn into a monthly cadence. It is built to force clarity: one set of numbers, one diagnosis, one path, and a small set of experiments.
Metrics to watch weekly (not just monthly)
Monthly MRR is too slow for fast feedback. Track leading indicators that move before churn hits revenue. If you only look at MRR, you will always be late.
- New MRR, Expansion MRR, Contraction MRR, Churned MRR: the movement breakdown that explains the dip.
- Activation rate: % of new accounts reaching the value moment within a defined window (for example, 7 days).
- Time to first value: median hours or days from signup to value moment; watch for drift after releases.
- GRR and NRR: retention health of the existing base; track by cohort and by segment.
- Support load signals: ticket rate per 100 active accounts, first response time, and reopen rate; spikes often precede churn.
Questions to ask in the weekly stall review
Make the review short and consistent. The point is not to debate opinions. The point is to converge on the most likely failure mode and decide what to test next.
- Is the dip real? Did definitions, billing timing, or event tracking change?
- Which MRR component moved? New, expansion, contraction, or churned MRR?
- Which segment drove it? Plan, tenure bucket, channel, industry, company size.
- Did activation change? If yes, which onboarding step or milestone dropped?
- What did customers say? Summarize top 3 churn reasons with counts and examples.
Experiment rules that prevent scattered feature shipping
Experiments fail when they are vague. “Improve onboarding” is not an experiment. An experiment has a hypothesis, a change, a metric, and a time box. It also has a clear “stop” rule so you do not keep investing in a dead end.
- One primary metric: pick one, such as activation rate from 30% to 40% in 4 weeks.
- One segment first: run the change on a cohort (new signups, one plan) before rolling out.
- Time box: 2 - 4 weeks for leading indicators, 6 - 8 weeks for retention movement.
- Instrument before shipping: define events and dashboards so you can measure impact within days.
- Write the learning: what changed, what moved, what you will do next; keep it in one doc.
Common panic moves that make the dip worse
Some responses feel productive but increase risk. They either hide the real problem or create new churn drivers. Avoid them unless the diagnosis clearly supports them.
- Shipping a big feature without a retention hypothesis: it delays learning and often increases complexity for new users.
- Discounting as the default response: it can increase low fit acquisition and train customers to wait for deals.
- Changing pricing for everyone overnight: it can trigger involuntary churn and support overload; test on new cohorts first.
- Switching channels because “the last one is dead”: channels fatigue, but often the issue is conversion or ICP mismatch, not the channel itself.
- Blaming support or sales without data: most dips are system issues across funnel stages, not one team failing.
Conclusion: treat the dip as feedback, not a verdict
Your first MRR dip is a signal that momentum is no longer masking system weaknesses. Flat acquisition plus rising churn will always win if you do not intervene. The good news is that the fix is usually not mysterious. It is visible when you break MRR into movements, segment churn, and connect product usage to the value moment.
The teams that recover fastest do not “work harder.” They get specific. They decide where the system is breaking, talk to the customers who left, and choose one focused path for a short cycle of experiments. Over time, that becomes a habit: a stall playbook you can run without panic.
At Apptension, we often support product teams during these inflection points by tightening instrumentation, improving onboarding flows, and turning qualitative churn feedback into a measurable experiment backlog. The goal is simple: fewer surprises, faster learning, and a product that earns retention instead of hoping for it.