A global energy group

Creating an internal data vizualization tool for a global energy group with an integration with a custom-built CMS.
Expertise

Project management 

Frontend development

Industry

Energy

Timeline

About

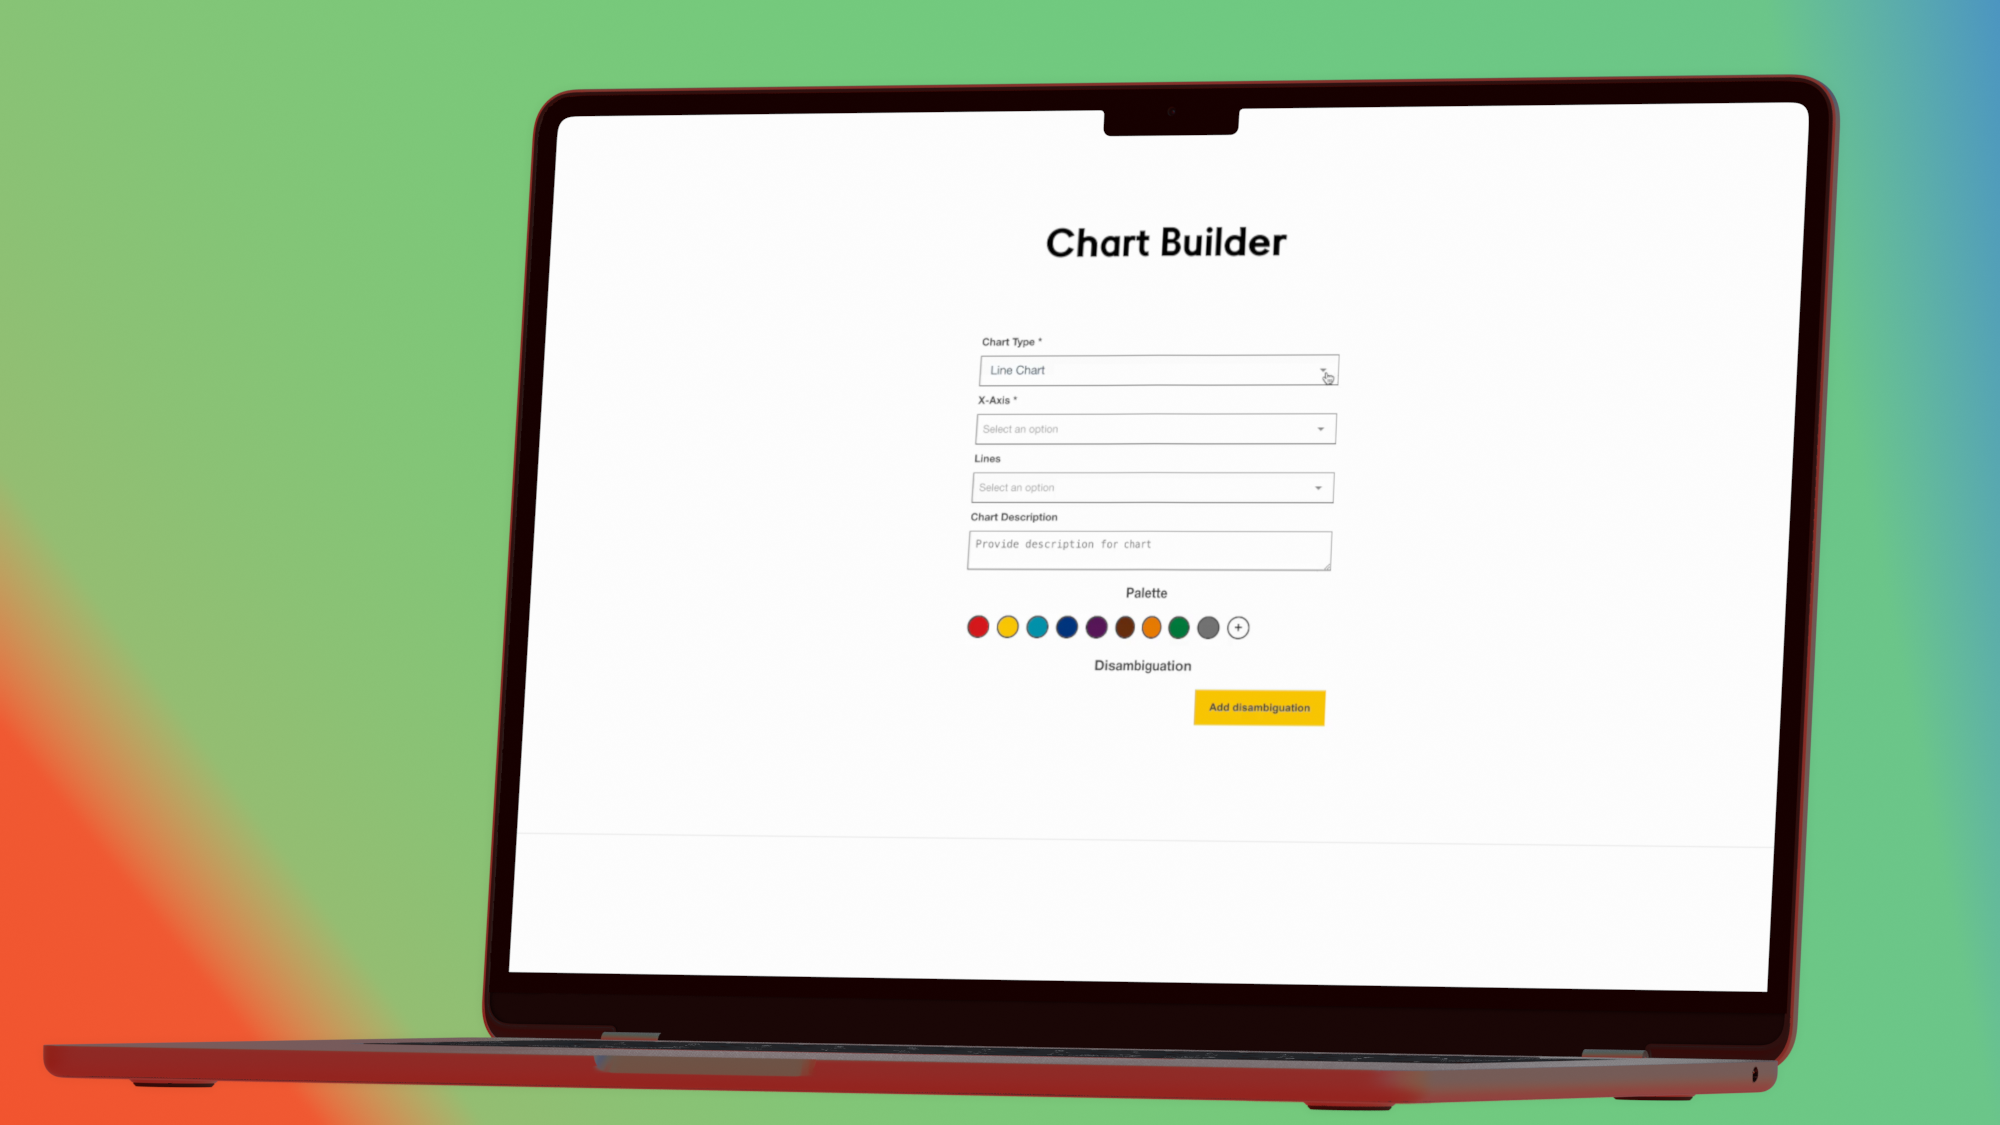
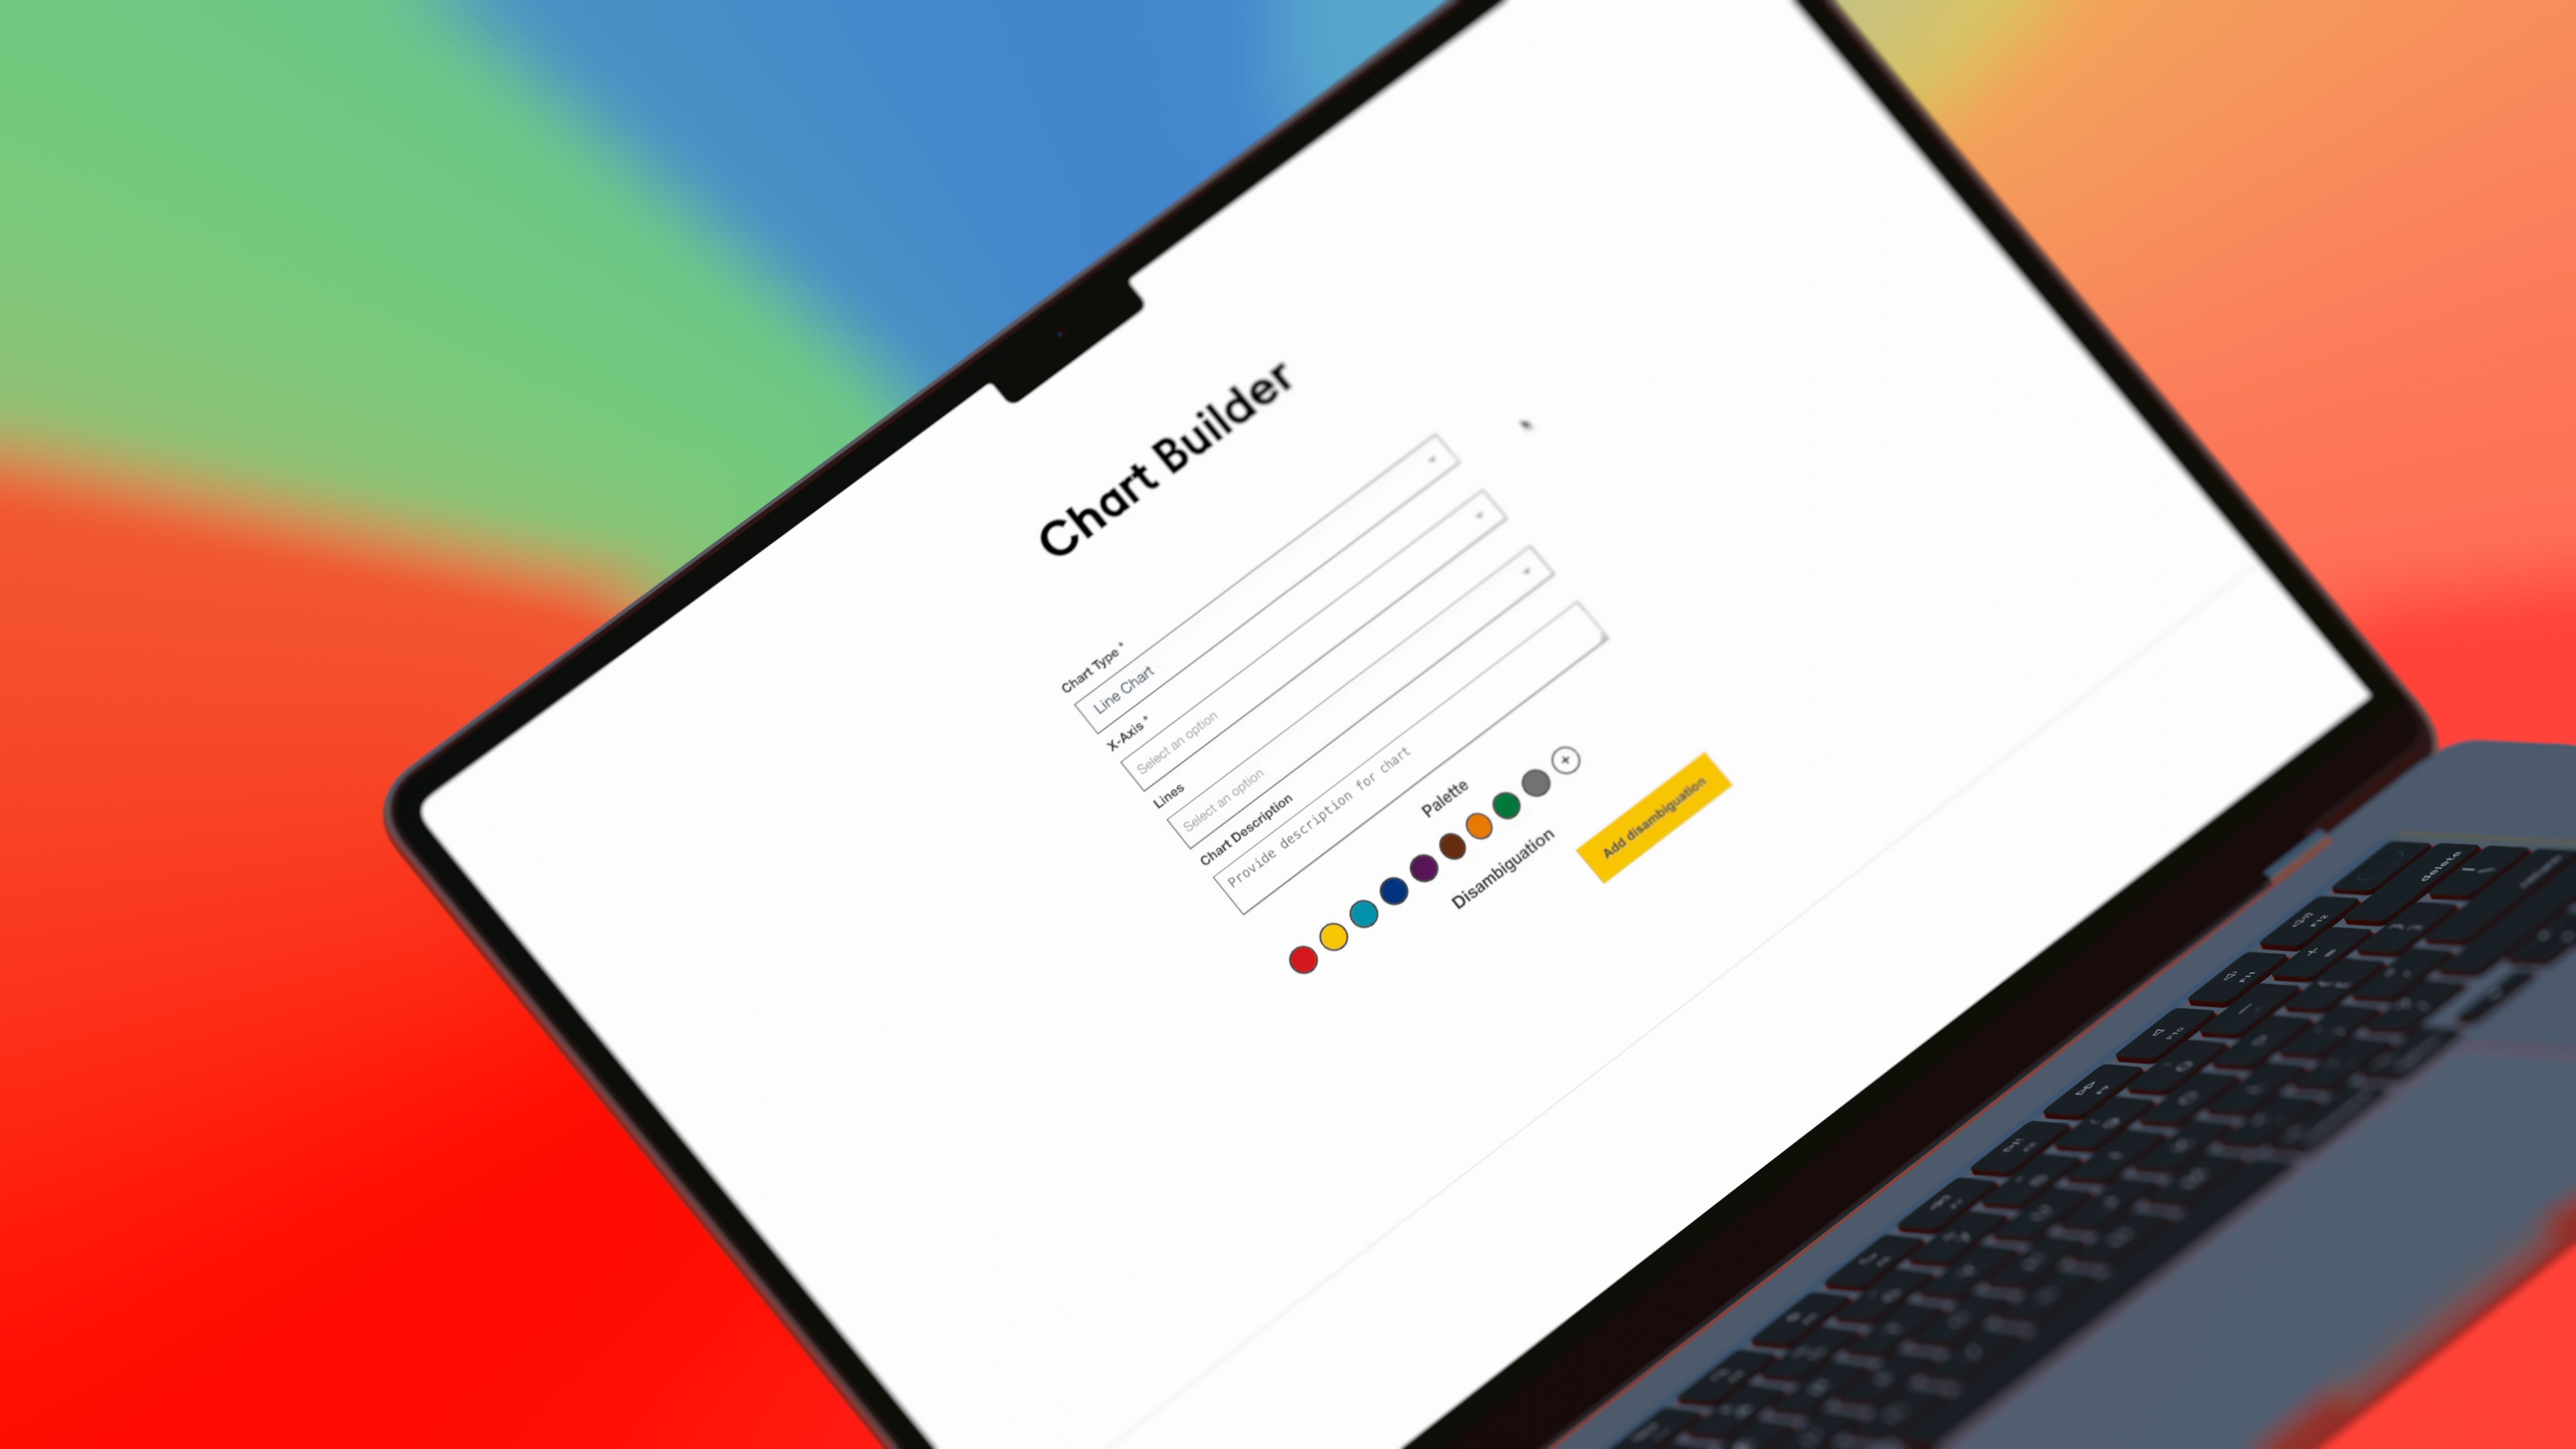
When an American creative agency, Schema, sought to weave innovation into a data visualization tool for a global energy and petroleum concern, they approached the Apptension team for a collaborative endeavor. Our team was meant to develop a sophisticated, user-friendly chart builder designed to seamlessly integrate with a custom-built CMS.
Challenge

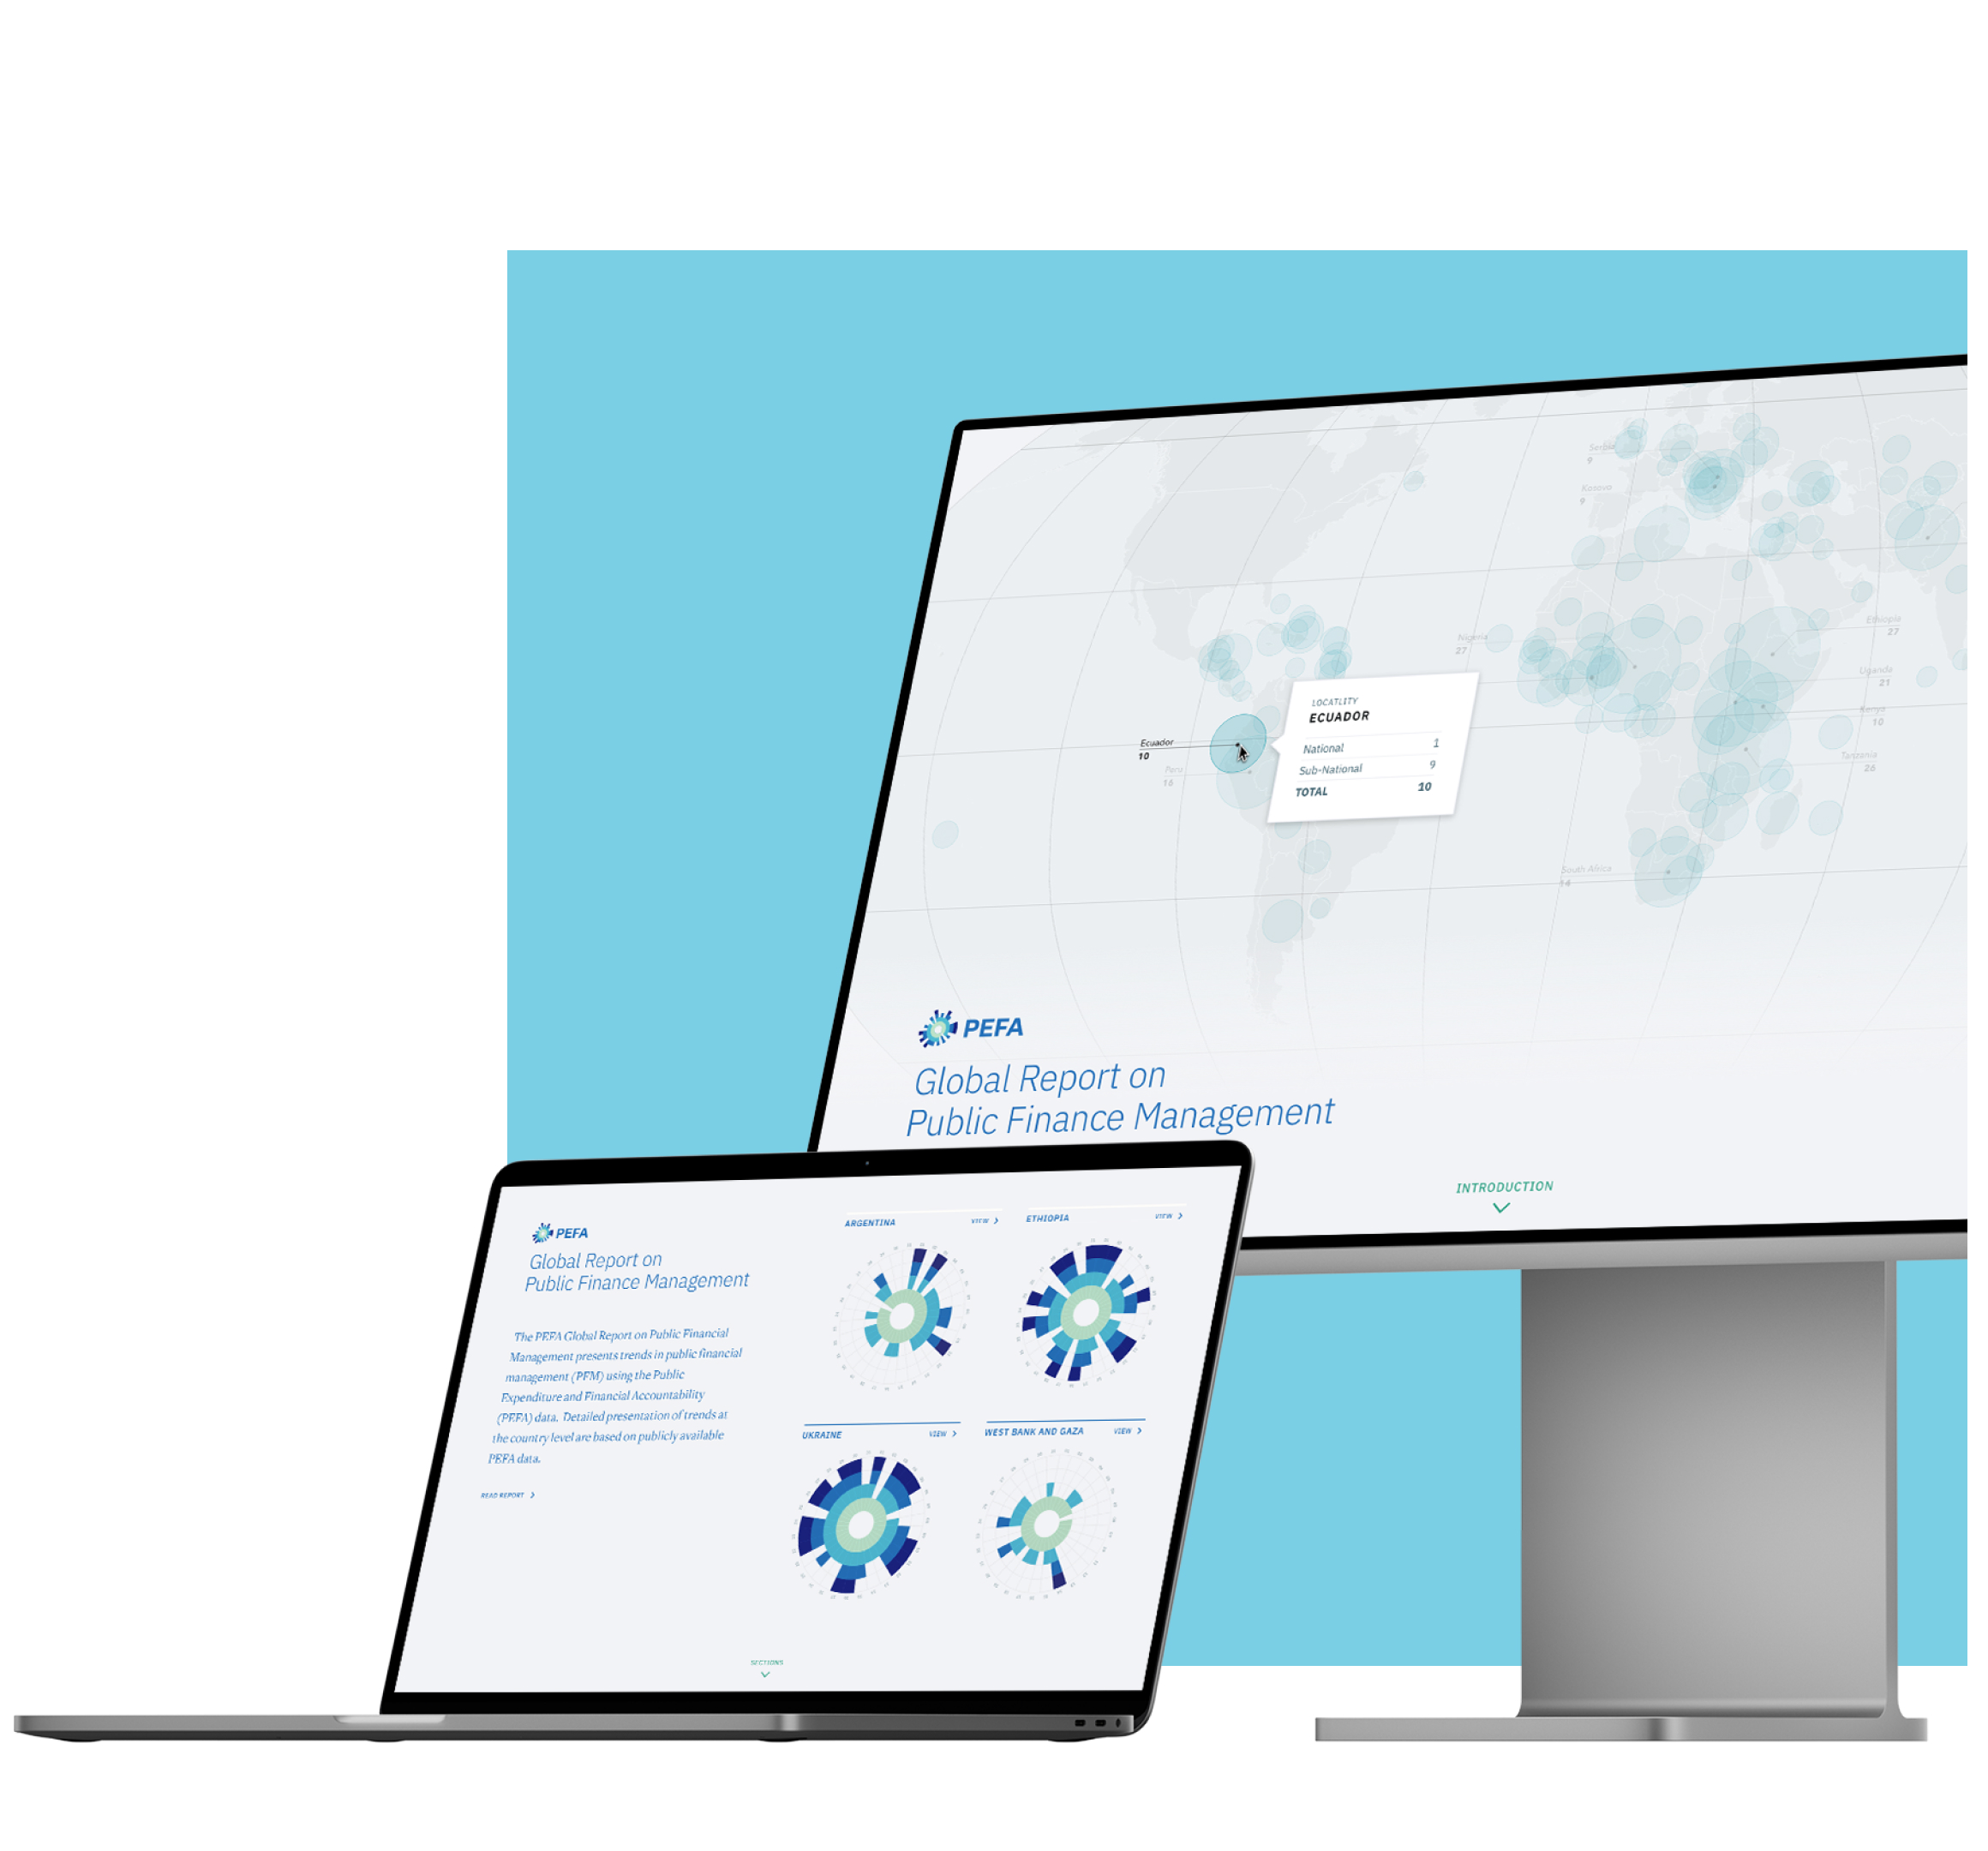
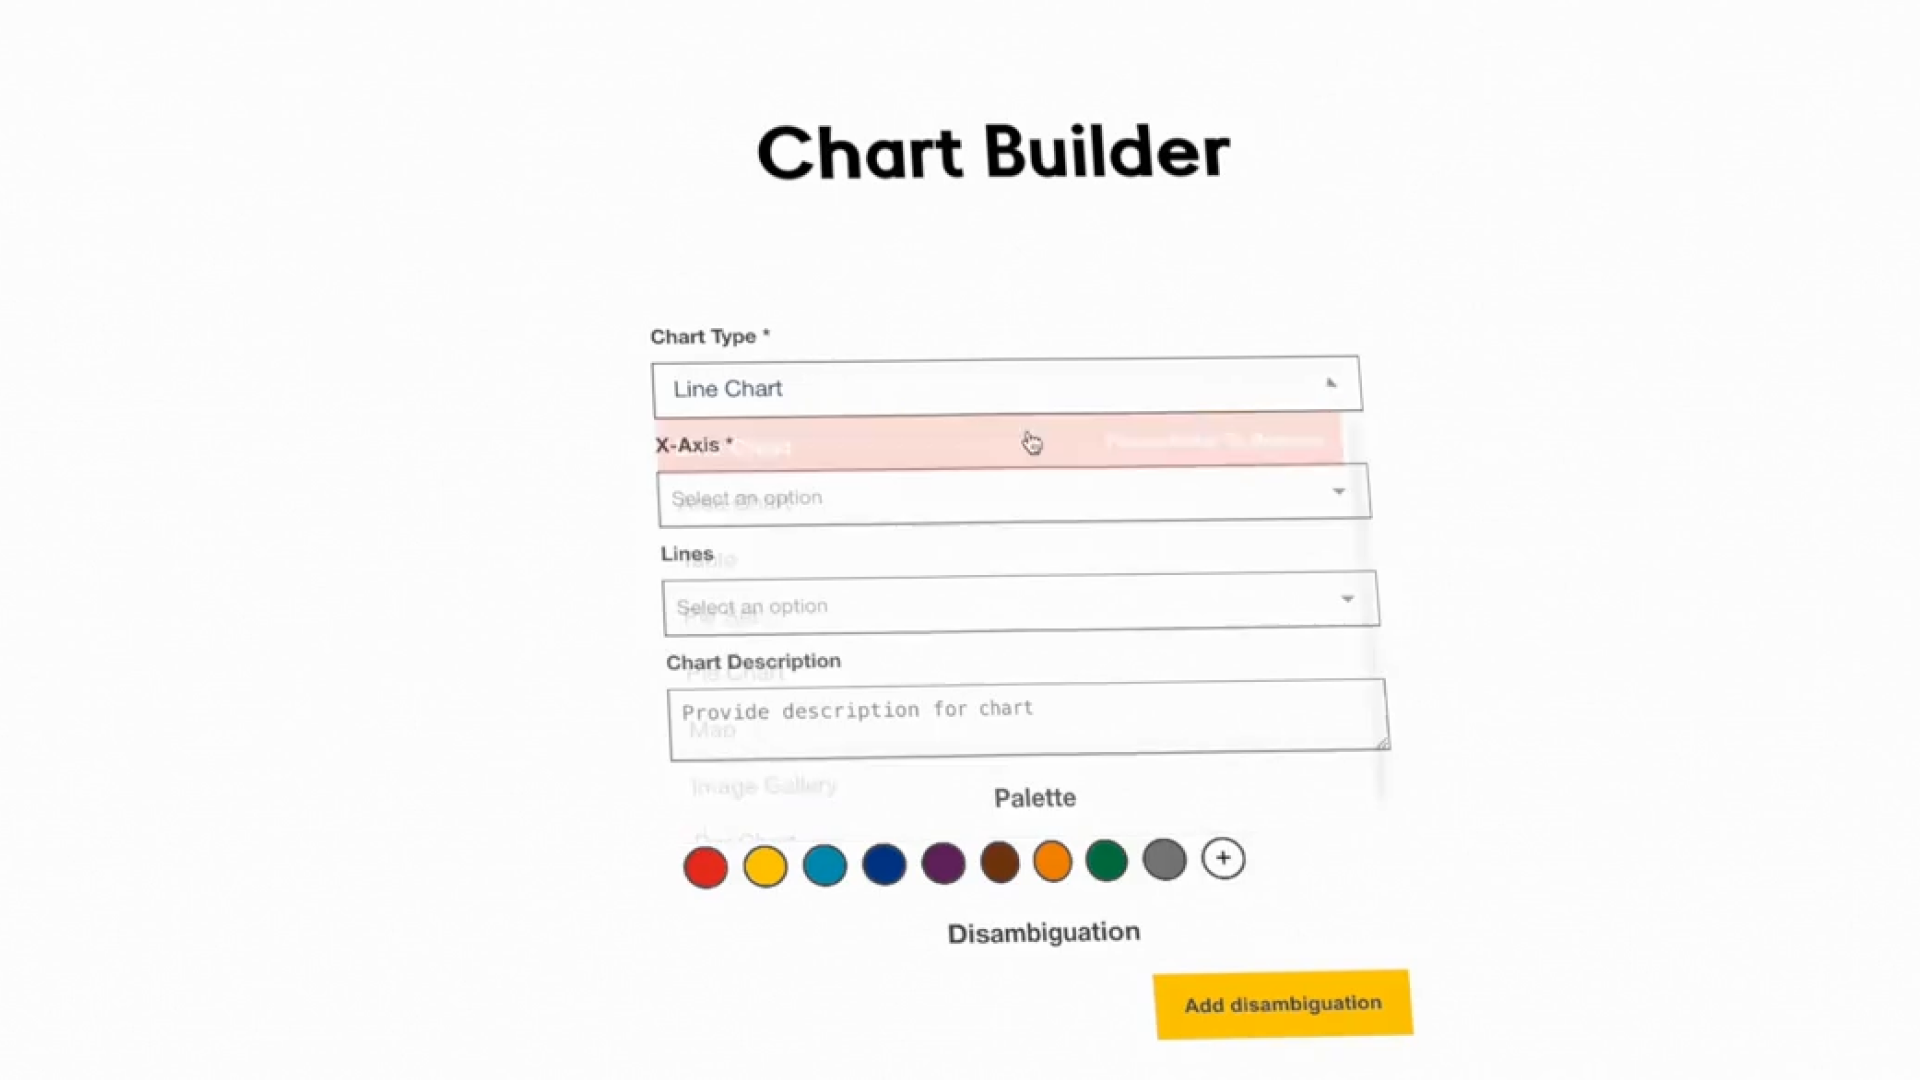
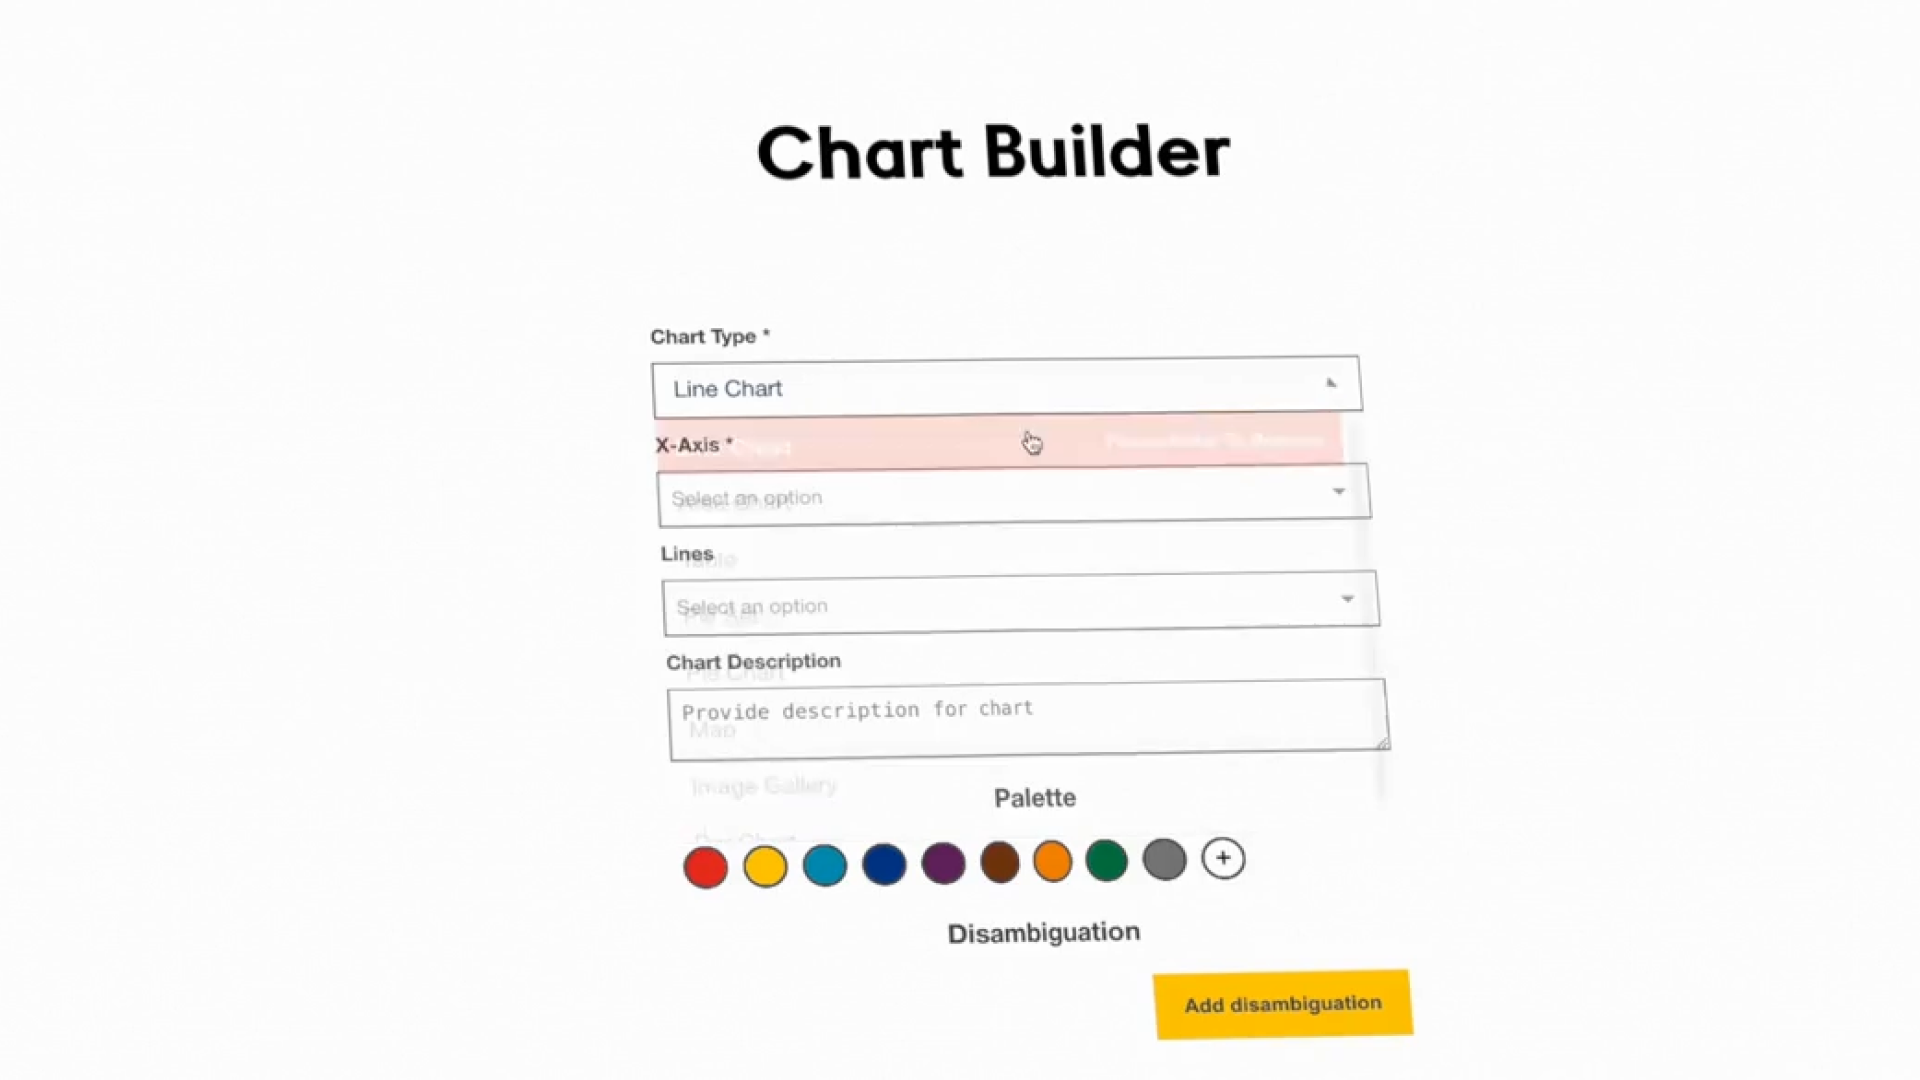
Our client required a versatile chart builder to handle diverse data sets, from furniture images to intricate financial metrics. The tool had to support various chart types and tables, with markdown rendering in cells. A user-configurable filtering mechanism was essential, and once a chart was crafted, its configuration needed encapsulation in a shareable URL. Additionally, the client sought a solution that would be easily embeddable across web pages without complex technicalities.

Process

Our collaboration started with discussions with the client to enable our team to understand the visualization needs. We recognized the potential of using a custom-built CMS, so we strategized its development and integration with the chart builder for diverse data access. 

The CMS we used was SchemaCMS, a Contentful-like tool we built earlier specifically for Schema agency. The tools main purpose is to enable the client to upload data through CSV files, Google spreadsheets, or API integration with other tools. Later, the data could be used for building and manipulating the pages built using SchemaCMS.

Our design team then developed wireframes and prototypes, ensuring functionality and intuitiveness. Next, using Vue, D3, and StyledComponents, the developers transformed the designs into a dynamic tool. Rigorous testing followed, leading to deployment and training sessions. We remained receptive to feedback, refining the tool to align with the client's evolving needs.

Solution

Our solution hinged on three tech pillars: Vue for dynamic user experience, D3 for charting, and StyledComponents for appearance. Integration with the CMS we built ensured the versatility of the options. 

The tool allowed users to weave data stories through various chart types, supported by a robust filtering mechanism. Each chart's essence was captured in a URL, facilitating easy sharing. Embedding these visual stories became effortless, making the tool not just a utility but a powerful storyteller for the client's narratives.

Get in touch

Have a project in mind? Send us the details and we will reach out to you with the next steps.

Oops! Something went wrong. Please try again.